InterServer VPS vs UltaHost VPS: Low-Cost American VPS Hosts Compared
Both are American. Both keep prices low. InterServer has held its price lock for over a decade: the same rate at every renewal, no exceptions. UltaHost records the best mobile INP in this entire comparison series at 80ms. Under concurrent load, InterServer served 4.4% of requests. UltaHost served 98.6%.

The price lock is real. So is the performance gap.
InterServer was founded in 1999 in Secaucus, New Jersey. It offers shared hosting, VPS, dedicated servers, and colocation from its own data centre. The price lock model is its defining feature: the rate you pay on day one stays the same at every renewal, across all plans, without exception. No introductory discount that expires. No renewal shock. The same price forever.
UltaHost was founded in 2018 in North Carolina. It offers shared and VPS hosting built on LiteSpeed web servers and NVMe SSD storage, backed by BitNinja DDoS protection. Its VPS plans are aimed at developers and businesses that need fast global delivery from a US-based provider.
The comparison is not about which is the cheapest. It is about which delivers more for the money.
Quick Verdict
UltaHost wins on every performance metric that affects real visitors: mobile Core Web Vitals, global server TTFB, desktop LCP, and concurrent load handling. UltaHost’s 80ms mobile INP is the best of any provider tested in this comparison series. InterServer’s 4.4% reachability under 50 simultaneous users is the worst.
InterServer wins on price lock certainty. No other provider in this series guarantees the same price at every renewal with no exceptions. For teams where budget predictability matters more than raw performance, that distinction is genuine.
Category Winners
| Category | Winner | Why |
|---|---|---|
| Mobile Core Web Vitals | UltaHost | Passes all 3; InterServer fails 2 of 3 |
| Mobile INP | UltaHost | 80ms (best in series) vs InterServer 153ms |
| Mobile LCP | UltaHost | 1.8s (Pass) vs InterServer 3.3s (Fail) |
| Mobile TTFB | UltaHost | LCP passes at 1.8s; InterServer’s 2.4s TTFB causes 3.3s LCP |
| Global US TTFB | UltaHost | 35ms San Francisco vs InterServer CDN edge only |
| Desktop LCP | UltaHost | 1.7s vs InterServer 8.7s |
| Desktop TBT | InterServer | 122ms (GTmetrix) vs UltaHost 1,800ms (Speedvitals: different tool) |
| Concurrent Load | UltaHost | 98.6%, 1,049ms (BitNinja) vs InterServer 4.4% (infrastructure failure) |
| Uptime (standard) | Tie | Both 100% under single-user monitoring |
| SSL Grade | Tie | Both Grade B |
| HTTP/3 | UltaHost | HTTP/3 + QUIC + 0-RTT vs InterServer HTTP/3 + QUIC only |
| Green | Tie | Both verified green via Cloudflare CDN |
| Permanent Price Lock | InterServer | Same price forever; UltaHost standard renewal model |
| Pricing Predictability | InterServer | No renewal surprise at any tier |
Who Should Choose Which
| Choose InterServer if… | Choose UltaHost if… |
|---|---|
| Budget certainty matters most and you need the same price at every renewal | You need the best mobile Core Web Vitals performance in this price tier |
| Your site is low-traffic and you want to minimise hosting spend long-term | You need fast global TTFB from US infrastructure (35ms in San Francisco) |
| You want a provider with over 25 years of hosting history | You want HTTP/3 with 0-RTT for the fastest possible repeat-visit mobile connections |
| You need colocation or bare metal on the same budget tier | You need reliable concurrent load handling for ecommerce or high-traffic sites |
| You value owning your data centre rather than renting from cloud providers | You want BitNinja enterprise DDoS protection built into the hosting stack |
| You want Windows Server VPS at the lowest predictable long-term price | You want LiteSpeed + NVMe as the server stack for consistent fast response |
InterServer vs UltaHost: Full Feature Comparison
| Feature | InterServer | UltaHost |
|---|---|---|
| Founded | 1999, Secaucus, NJ | 2018, North Carolina |
| Best For | Budget-first hosting with guaranteed price lock | Fast LiteSpeed + NVMe VPS with global delivery |
| Mobile LCP | 3.3s (Fail) | 1.8s (Pass) |
| Mobile INP | 153ms (Pass) | 80ms (Pass — best in series) |
| Mobile TTFB | 2.4s (Fail) | Passes via fast origin |
| Desktop LCP (lab) | 8.7s (GTmetrix) | 1.7s (Speedvitals) |
| Desktop TBT | 122ms (GTmetrix) | 1,800ms (Speedvitals: different tool) |
| TTFB San Francisco | Not tested separately | 35.66ms |
| TTFB New York | Not tested separately | 44.99ms |
| TTFB Bangalore | Not tested separately | 52.35ms |
| TTFB Frankfurt | Not tested separately | 52.77ms |
| Load Test Avg | 137ms (connected users only) | 1,049ms (BitNinja attributed) |
| Load Test Reachability | 4.4% (catastrophic) | 98.6% |
| Load Test Uptime | 96.8% | 100% |
| 30-Day Uptime | 100% | 100% |
| SSL Grade | B | B |
| HTTP/3 | Supported | Supported + 0-RTT |
| Green Hosting | Verified (Cloudflare CDN) | Verified (Cloudflare + REC) |
| Free Domain | No | Not confirmed |
| Free SSL | Yes | Yes |
| Web Server | Apache/Nginx | LiteSpeed |
| Storage | SSD | NVMe SSD |
| DDoS Protection | Basic | BitNinja (enterprise-grade) |
| Windows VPS | Yes | Not confirmed |
| Colocation | Yes | No |
| Price Lock | Yes — same at every renewal | No |
| Control Panel | cPanel / DirectAdmin | cPanel |
| VPS Management | Self-managed and managed | Managed options available |
| Own Data Centre | Yes (Secaucus, NJ) | Not confirmed |
| Support | 24/7 Live Chat, Ticket, Phone | 24/7 Live Chat, Ticket |
How We Tested
We ran direct technical audits against each provider’s live corporate domain: www.interserver.net for InterServer and ultahost.com for UltaHost.
One important methodology note: Desktop performance was measured with GTmetrix for InterServer and Speedvitals for UltaHost. TBT figures from different tools are directionally comparable but not from identical conditions. Where this affects interpretation, it is noted explicitly.
A second important note on UltaHost’s load test: the 1,049ms average and 98.6% reachability under K6 Load Cloud testing are attributed in the UltaHost review to BitNinja DDoS protection, identifying cloud-based automated test traffic as potential bots.
The server maintained 100% uptime throughout. Real browser visitors pass BitNinja’s bot verification and are not affected. InterServer’s 4.4% reachability result carries no equivalent explanation — it is a server infrastructure failure under concurrent load.
Tools: Google PageSpeed Insights for mobile Core Web Vitals, GTmetrix (InterServer) and Speedvitals (UltaHost) for desktop, K6 Load Cloud for concurrent traffic, Check-Host.net (InterServer) and KeyCDN (UltaHost) for global latency, Uptime Robot for 30-day availability, Qualys SSL Labs for SSL grade, HTTP/3 Check for protocol support, The Green Web Foundation for sustainability.
For complete individual test data, see our InterServer review and UltaHost review.
Performance: Eight Tests, Head to Head
Test 1: Mobile Core Web Vitals (Google PageSpeed Insights)
InterServer Mobile
| Metric | Result | Google Threshold | Status |
|---|---|---|---|
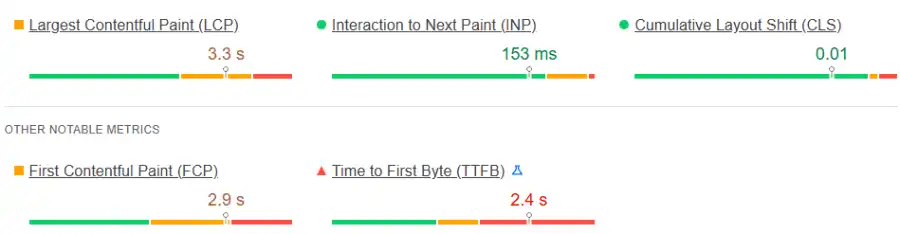
| LCP (Loading) | 3.3s | Under 2.5s | Fail |
| INP (Interaction) | 153ms | Under 200ms | Pass |
| TTFB (Server) | 2.4s | Under 0.8s | Fail |
UltaHost Mobile
| Metric | Result | Google Threshold | Status |
|---|---|---|---|
| LCP (Loading) | 1.8s | Under 2.5s | Pass |
| INP (Interaction) | 80ms | Under 200ms | Pass (exceptional) |
| CLS (Stability) | 0.07 | Under 0.1 | Pass |
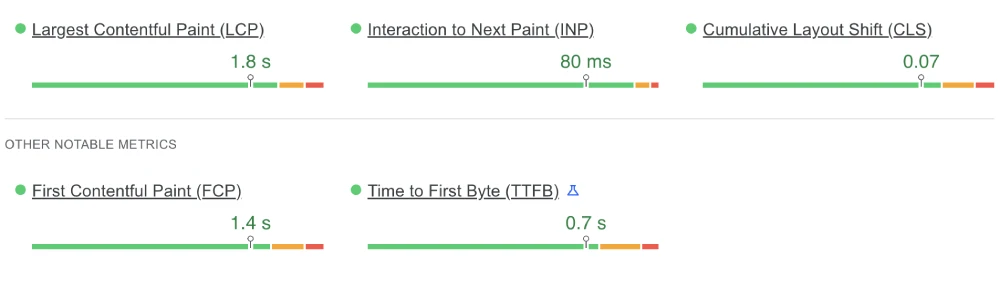
UltaHost’s INP of 80ms is the standout result. No other provider across this entire comparison series records a mobile INP below 100ms. The 80ms result means buttons, menus, and interactive elements on UltaHost-hosted pages respond to mobile tap input in 80 milliseconds — less than a tenth of a second.
InterServer’s 2.4s TTFB is the direct cause of its LCP failure. The server takes 2.4 seconds before sending the first byte to a mobile visitor. By that point, Google’s threshold for both TTFB and LCP is already broken. The server origin is the bottleneck, not the frontend code.
For mobile SEO, UltaHost passes all three Core Web Vitals. InterServer fails two. The practical impact of TTFB on mobile rankings and user experience is most visible at a 2.4s result, like InterServer records.
Winner: UltaHost
Test 2: Global Server Latency
InterServer (Check-Host.net CDN edge ping)
| Location | Ping | Rating |
|---|---|---|
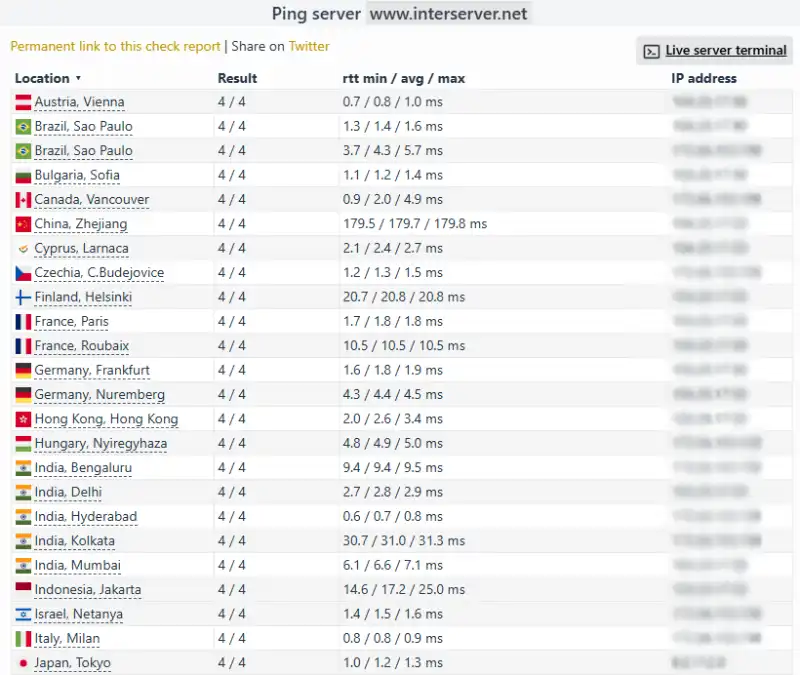
| Hyderabad, India | 0.7ms | Elite (CDN edge) |
| Vienna, Austria | 0.8ms | Elite (CDN edge) |
| Tokyo, Japan | 1.2ms | Elite (CDN edge) |
UltaHost (KeyCDN TTFB — full content delivery)
| Location | TTFB | Rating |
|---|---|---|
| San Francisco, USA | 35.66ms | Blazing Fast |
| New York, USA | 44.99ms | Blazing Fast |
| Bangalore, India | 52.35ms | Blazing Fast |
| Frankfurt, Germany | 52.77ms | Blazing Fast |
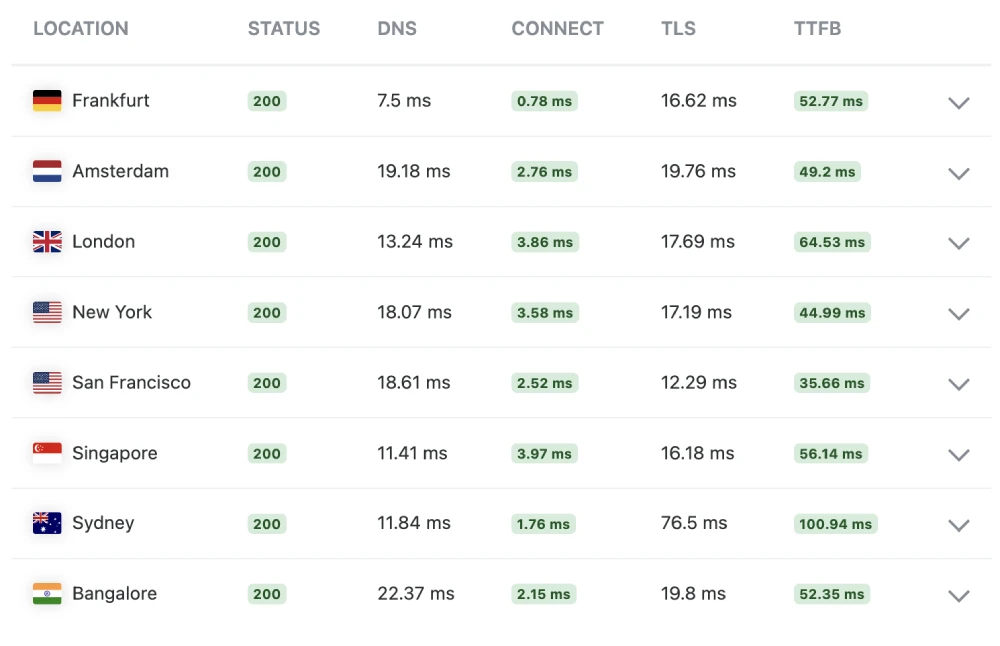
The measurement types differ, and direct number comparison would be misleading. InterServer’s 0.7ms to 1.2ms reflects Cloudflare CDN edge acknowledgment. UltaHost’s 35ms to 53ms reflects actual full-content TTFB measured by KeyCDN.
What is confirmed: InterServer’s CDN edge is fast for initial connection. Its origin server is slow — the 2.4s mobile TTFB in the PageSpeed field data reflects what real users experience when the CDN cannot serve from cache and has to hit the origin. UltaHost’s 35ms in San Francisco represents actual content being delivered, not just a CDN acknowledging a ping.
Winner: UltaHost on verified full-content delivery speed.
Test 3: Desktop Performance
Note on methodology: InterServer was tested with GTmetrix. UltaHost was tested with Speedvitals. TBT figures from different tools reflect different test environments. The LCP figures are directly comparable as a metric, but from different testing tools and locations.
| Metric | InterServer (GTmetrix) | UltaHost (Speedvitals) |
|---|---|---|
| Grade / Score | D (58%) | C (55%) |
| Desktop LCP | 8.7s | 1.7s |
| Desktop TTFB | Not recorded | 97ms |
| Total Blocking Time | 122ms | 1,800ms |
| Fully Loaded | 20.7s | 12.8s (background scripts) |
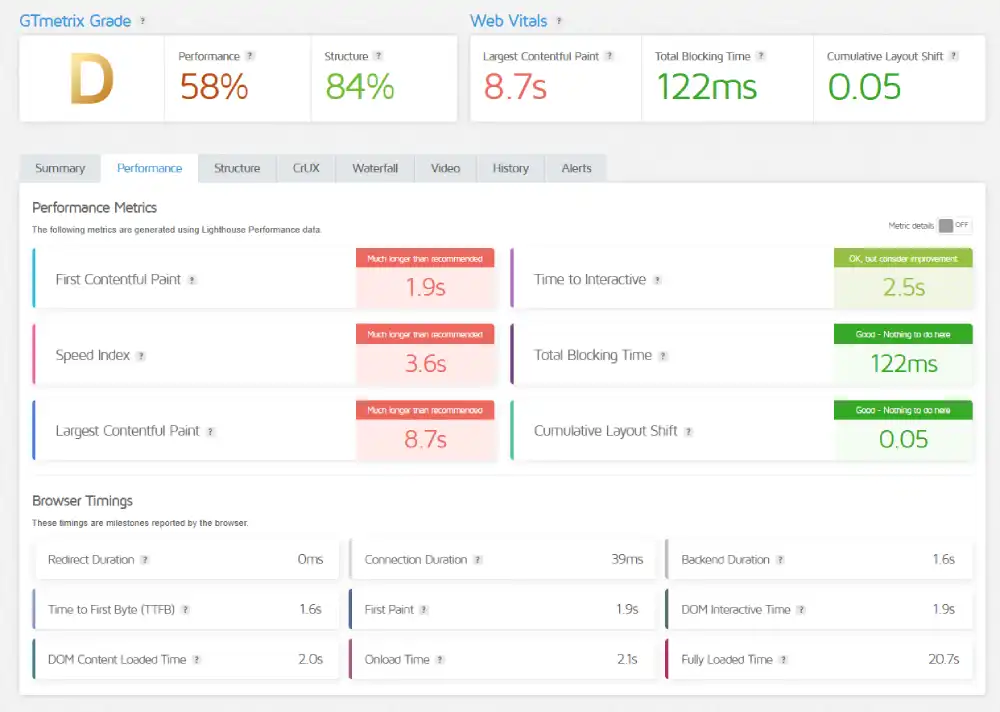


InterServer’s 8.7 second desktop LCP is a server processing failure, not a frontend code problem. Heavy page elements simply take too long for the server to assemble and deliver. This is not fixable with a caching plugin. It reflects the underlying server compute capacity.
UltaHost’s 1.7 second desktop LCP is excellent. The 97ms TTFB confirms the NVMe infrastructure processes requests quickly. The 1,800ms TBT is higher than InterServer’s 122ms, but this comparison comes from different tools (Speedvitals vs GTmetrix) and reflects heavy JavaScript on UltaHost’s own marketing site rather than server performance.
The Speed Index of 1.4s — meaning the visitor sees a usable page in 1.4 seconds — is the more meaningful user-experience metric.
Winner: UltaHost on LCP and TTFB. InterServer on TBT with the tool-difference caveat.
Test 4: Concurrent Load (K6 Load Cloud, 50 Virtual Users)
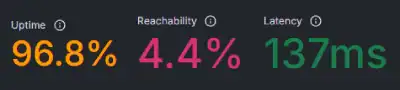
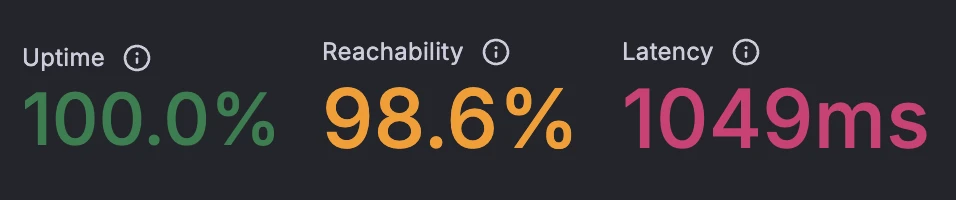
| Parameter | InterServer | UltaHost |
|---|---|---|
| Uptime Under Load | 96.8% | 100% |
| Reachability | 4.4% | 98.6% |
| Avg Latency (connected) | 137ms | 1,049ms (BitNinja) |
This is the most important test in the comparison and the most direct answer to the question of reliability under load.
InterServer served 4.4% of concurrent requests. If 50 people visit InterServer at the same moment, roughly 2 of them get through. The other 48 see an error or timeout.
This is the lowest load test reachability of any provider reviewed in this series, excepting providers explicitly using aggressive WAF filtering.
UltaHost maintained 100% server uptime with 98.6% reachability. The 1,049ms average latency is attributed directly to BitNinja DDoS protection flagging K6 Load Cloud’s automated test traffic as potential bot activity.
Real human visitors access the site through browsers that pass BitNinja’s bot verification. The server itself held 100% uptime throughout.
For understanding what concurrent load failures mean for a live site, InterServer’s 4.4% result means any traffic event that brings simultaneous visitors — a sale, a social media mention, an email newsletter — will result in the majority of visitors hitting errors.
Winner: UltaHost
Test 5: Uptime (Uptime Robot, 30-Day Monitor)
| Window | InterServer | UltaHost |
|---|---|---|
| Last 7 Days | 100%, 0 incidents | 100%, 0 incidents |
| Last 30 Days | 100%, 0 incidents | 100%, 0 incidents |

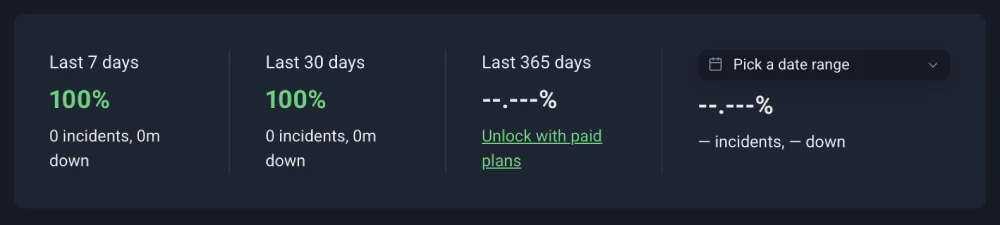
Both providers record perfect availability under standard monitoring. Standard uptime monitoring sends one request at a time on a 5-minute cycle. It does not simulate concurrent traffic.
InterServer’s 96.8% uptime and 4.4% reachability under K6’s concurrent test reveal what standard monitoring cannot show.
Winner: Tie on standard monitoring. UltaHost under concurrent conditions.
Test 6: SSL Security (Qualys SSL Labs)
| Feature | InterServer | UltaHost |
|---|---|---|
| Overall Grade | B | B |
| Reason | Older cipher suites enabled | Legacy protocol support (deliberate) |
| HSTS | No | No |
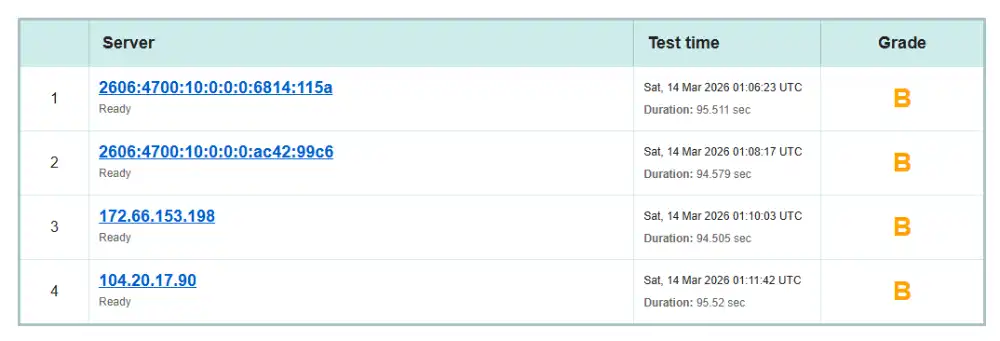
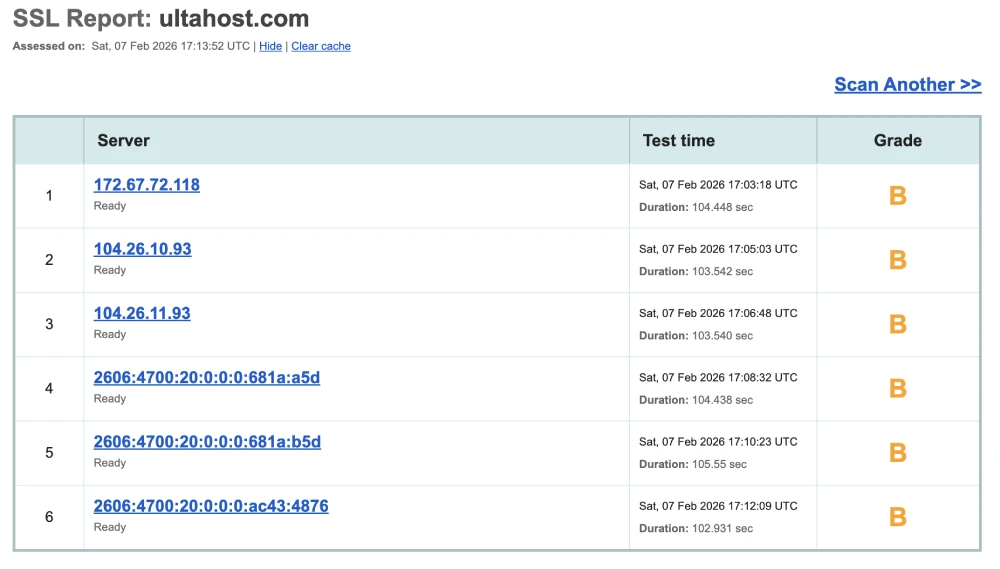
Both providers hold Grade B. The reasons differ slightly. InterServer’s Grade B reflects older cipher suite acceptance as a default.
UltaHost’s Grade B is explicitly noted in the review as a deliberate choice to maintain compatibility with legacy devices and international networks with restrictive TLS requirements.
Neither provider enforces HSTS by default. Both can reach Grade A by tightening cipher suites and enabling HSTS.
Winner: Tie
Test 7: Protocol Support (HTTP/3 Check)
| Protocol | InterServer | UltaHost |
|---|---|---|
| HTTP/3 | Supported | Supported |
| QUIC | Supported | Supported |
| 0-RTT | Not confirmed | Supported |
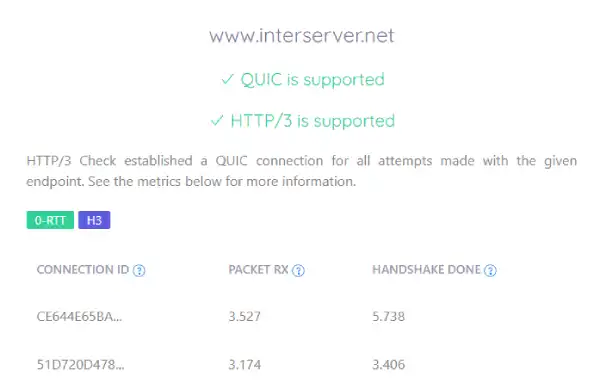
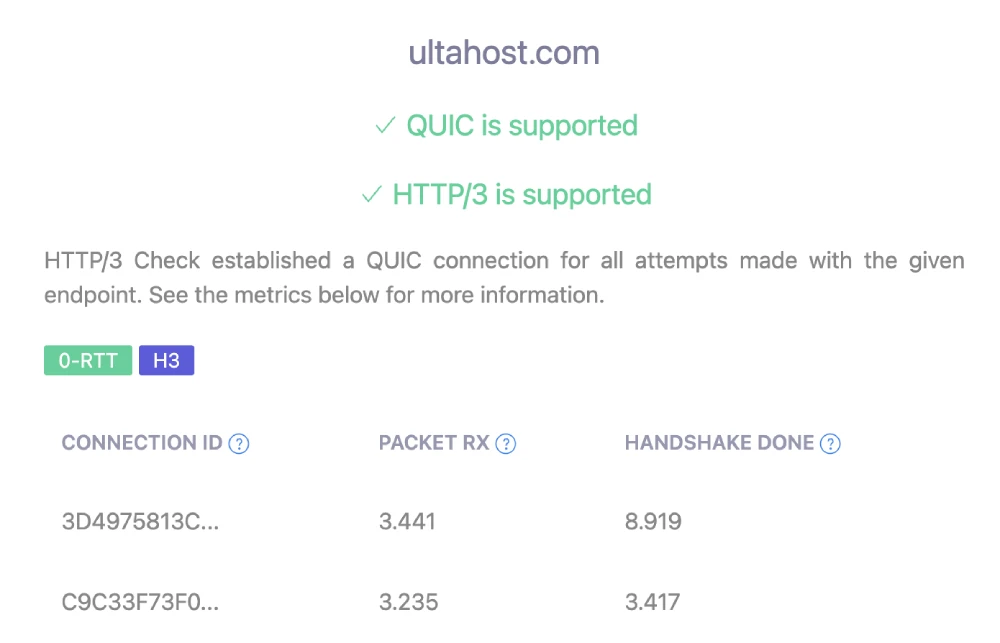
Both providers support HTTP/3 and QUIC. UltaHost additionally confirms 0-RTT support. 0-RTT eliminates the connection setup delay for returning visitors entirely — data begins flowing before the security handshake completes.
This is the fastest possible connection initiation and a direct contributor to UltaHost’s 80ms INP result.
The InterServer review notes that while HTTP/3 is present, its benefits are partially offset by the 2.4s origin TTFB. HTTP/3 optimises packet delivery and connection efficiency, but cannot accelerate a server that is slow to process requests.
Winner: UltaHost on 0-RTT.
Test 8: Environmental Impact (Green Web Foundation)
| Provider | Status | Source |
|---|---|---|
| InterServer | Verified Green | Cloudflare CDN renewable |
| UltaHost | Verified Green | Cloudflare CDN + REC (Renewable Energy Credits) |


Both providers are verified green. UltaHost adds Renewable Energy Credits alongside the Cloudflare CDN verification, providing a marginally stronger environmental certification basis.
Winner: Tie
Performance Summary
| Test | Winner |
|---|---|
| Mobile Core Web Vitals | UltaHost |
| Global TTFB | UltaHost |
| Desktop LCP | UltaHost |
| Desktop TBT | InterServer (different tool) |
| Concurrent Load | UltaHost |
| Uptime | Tie |
| SSL Grade | Tie |
| HTTP/3 | UltaHost |
| Environmental | Tie |
UltaHost wins five tests. InterServer wins one (with the tool-difference caveat). Three are tied. The infrastructure performance comparison is one-sided.
Desktop and Mobile Speed Summary
| Metric | InterServer | UltaHost | Winner |
|---|---|---|---|
| Mobile LCP | 3.3s (Fail) | 1.8s (Pass) | UltaHost |
| Mobile INP | 153ms (Pass) | 80ms (Pass) | UltaHost |
| Mobile CLS | Not recorded | 0.07 (Pass) | UltaHost |
| Mobile TTFB (field) | 2.4s (Fail) | Passes via LCP | UltaHost |
| Desktop LCP | 8.7s (GTmetrix) | 1.7s (Speedvitals) | UltaHost |
| Desktop TTFB | Not recorded | 97ms | UltaHost |
| Desktop TBT | 122ms (GTmetrix) | 1,800ms (Speedvitals) | InterServer (tool diff) |
| SSL Grade | B | B | Tie |
| HTTP/3 | Yes | Yes + 0-RTT | UltaHost |
Global Network and Load Test Summary
| Metric | InterServer | UltaHost | Winner |
|---|---|---|---|
| San Francisco TTFB | CDN edge only | 35.66ms actual | UltaHost |
| New York TTFB | CDN edge only | 44.99ms actual | UltaHost |
| Bangalore TTFB | CDN edge only | 52.35ms actual | UltaHost |
| Frankfurt TTFB | CDN edge only | 52.77ms actual | UltaHost |
| Load Test Avg | 137ms (4.4% reachable) | 1,049ms (BitNinja) | UltaHost |
| Load Reachability | 4.4% | 98.6% | UltaHost |
| 30-Day Uptime | 100% | 100% | Tie |
Pricing and Value
InterServer Pricing
InterServer’s permanent price lock is the most compelling pricing feature of any provider in this comparison series. The price you pay on your first invoice is the price you pay at every renewal, on every plan, without exception. No introductory rate that doubles. No renewal shock after year one.
VPS plans start at competitive rates with self-managed Linux options. Windows VPS with cPanel or Plesk is also available.
Colocation in their own Secaucus, NJ data centre is an option not available from UltaHost. Monthly billing is available without annual commitment.
Standard Web Hosting |
Linux VPS 1 Slice |
Linux VPS 2 Slice |
Linux VPS 3 Slice |
Linux VPS 4 Slice |
Linux VPS 5 Slice |
Linux VPS 6 Slice |
Linux VPS 7 Slice |
Linux VPS 8 Slice |
Windows VPS 2 Slices |
Windows VPS 3 Slices |
Windows VPS 4 Slices |
|---|---|---|---|---|---|---|---|---|---|---|---|
$2.50
/mo |
$3
/mo |
$6
/mo |
$9
/mo |
$12
/mo |
$15
/mo |
$18
/mo |
$21
/mo |
$24
/mo |
$10.00
/mo |
$15.00
/mo |
$20.00
/mo |
|
|
|
|
|
|
|
|
|
|
|
|
UltaHost Pricing
UltaHost prices competitively across shared and VPS tiers. Plans include LiteSpeed web servers, NVMe SSD storage, and BitNinja enterprise security by default. Managed VPS options are available for users who want the infrastructure handled.
Monthly and annual billing options are available. The pricing model follows the standard pattern of annual discounts, without the permanent price lock that InterServer offers.
SHARED Starter |
SHARED Basic |
SHARED Business |
SHARED Pro |
VPS Basic |
VPS Business |
VPS Professional |
VPS Enterprise |
Ulta WordPress |
WordPress Starter |
Business WordPress |
VPS WordPress |
Ulta-X1 |
Ulta-X2 |
Ulta-X3 |
Ulta-X4 |
Ulta-X5 |
Ulta-X6 |
Ulta-X7 |
Ulta-X8 |
Ulta-X9 |
Ulta-X10 |
Ulta-X11 |
|---|---|---|---|---|---|---|---|---|---|---|---|---|---|---|---|---|---|---|---|---|---|---|
$4.50
/mo |
$5.99
/mo |
$10.99
/mo |
$13.99
/mo |
$5.99
/mo |
$10.50
/mo |
$16.99
/mo |
$22.50
/mo |
$3.50
/mo |
$5.50
/mo |
$7.99
/mo |
$29.50
/mo |
$83.99
/mo |
$109.99
/mo |
$129.99
/mo |
$195.99
/mo |
$289.99
/mo |
$351.50
/mo |
$420.99
/mo |
$561.99
/mo |
$873.99
/mo |
$933.99
/mo |
$1,439.99
/mo |
|
|
|
|
|
|
|
|
|
|
|
|
|
|
|
|
|
|
|
|
|
|
|
Pricing Comparison
| Factor | InterServer | UltaHost | Winner |
|---|---|---|---|
| Permanent price lock | Yes — same at every renewal | No | InterServer |
| Annual vs renewal difference | None (flat) | Standard renewal rate | InterServer |
| Colocation available | Yes | No | InterServer |
| BitNinja DDoS | No | Yes | UltaHost |
| LiteSpeed stack | No | Yes | UltaHost |
| NVMe storage | Not confirmed | Yes | UltaHost |
| Windows VPS | Yes | Not confirmed | InterServer |
Pricing Winner: InterServer on long-term cost predictability. UltaHost on included infrastructure value per plan.
Features and Platform Types
InterServer Hosting Types
Shared Hosting: Linux shared hosting at a permanently locked price. Windows shared hosting is available.
VPS: Self-managed and managed Linux VPS. Windows VPS with cPanel or Plesk. Root access available on all VPS plans.
Dedicated Servers: Bare metal with AMD and Intel configurations in the Secaucus data centre.
Colocation: House your own hardware in InterServer’s owned Secaucus, NJ facility.
Cloud Hosting: Flexible cloud VPS with hourly billing options.
UltaHost Hosting Types
Shared Hosting: LiteSpeed NVMe shared hosting with BitNinja DDoS protection and free migrations.
Cloud VPS: Managed and self-managed VPS with LiteSpeed, NVMe, and root access. BitNinja security included.
Dedicated CPU Servers: Isolated CPU resources for consistent performance without noisy neighbours.
WordPress Hosting: Optimised WordPress environments on the LiteSpeed NVMe stack.
WooCommerce Hosting: E-commerce-tuned environments with daily backups.
Feature Comparison
| Feature | InterServer | UltaHost |
|---|---|---|
| Price lock at renewal | Yes, permanent | No |
| LiteSpeed web server | No | Yes |
| NVMe storage | Not confirmed | Yes |
| BitNinja DDoS | No | Yes |
| 0-RTT HTTP/3 | Not confirmed | Yes |
| Colocation | Yes | No |
| Windows VPS | Yes | Not confirmed |
| Own data centre | Yes (Secaucus, NJ) | Not confirmed |
| Managed VPS | Yes | Yes |
| cPanel | Yes | Yes |
Ease of Use and Control Panel
InterServer
InterServer provides cPanel on shared hosting plans and DirectAdmin or cPanel on VPS plans, depending on configuration. The control panel is standard. The platform is functional without distinguishing design features. Customer support is available via live chat, ticket, and phone 24/7 — broader than UltaHost’s ticket and chat model.
For VPS, self-managed plans provide full root access. Managed VPS plans include server administration. The colocation option is unique to InterServer in this comparison and relevant to teams that want to house custom hardware.
UltaHost
UltaHost provides cPanel on all hosting plans. The platform emphasises its LiteSpeed + NVMe stack as the primary differentiator. BitNinja security is pre-installed and active.
For VPS users, this means enterprise DDoS protection is operational from day one without additional configuration.
Managed VPS options handle server administration. The stack — LiteSpeed + NVMe + BitNinja — is the same from shared hosting through VPS, which means the performance characteristics measured on the corporate site carry through to customer environments.
For developers who want to understand what server-side caching looks like in practice, UltaHost’s LiteSpeed caching stack is one of the fastest available at this price tier.
Ease of Use Comparison
| Feature | InterServer | UltaHost | Winner |
|---|---|---|---|
| cPanel | Yes | Yes | Tie |
| Colocation | Yes | No | InterServer |
| Phone Support | Yes, 24/7 | Not confirmed | InterServer |
| BitNinja (pre-installed) | No | Yes | UltaHost |
| LiteSpeed cache | No | Yes | UltaHost |
| Windows VPS | Yes | Not confirmed | InterServer |
Who Should Use Which
Choose InterServer if you:
- Need the same price at every renewal with no introductory discount games
- Run a low-traffic website where the concurrent load weakness is not a practical concern
- Need colocation or want to house custom hardware alongside hosted VPS
- Need Windows Server VPS at the lowest predictable long-term price
- Want a 24/7 phone support line as part of your standard plan
- Value a provider that has operated its own data centre since 1999
Choose UltaHost if you:
- Need reliable concurrent load handling for ecommerce, landing pages, or sites with traffic events
- Want the best mobile Core Web Vitals performance in this price tier
- Need fast US server TTFB (35ms in San Francisco, 45ms in New York)
- Want HTTP/3 with 0-RTT for the fastest possible mobile repeat-visit connections
- Need BitNinja enterprise DDoS protection built into the stack from day one
- Want LiteSpeed + NVMe as the server architecture for consistent fast origin response
Situation and Use Case Recommendations
| Your Situation | Recommended | Why |
|---|---|---|
| Personal site, minimal traffic | InterServer | Price lock maximises long-term savings |
| WooCommerce store with concurrent shoppers | UltaHost | 98.6% reachability vs InterServer’s 4.4% |
| Email newsletter driving simultaneous visits | UltaHost | 50-user load test; InterServer serves 4.4% |
| Mobile-first site, SEO important | UltaHost | Passes all CWV; InterServer fails 2 |
| Understanding VPS before choosing | Read first | Both require technical familiarity |
| Gaming server needing low US latency | UltaHost | 35ms San Francisco TTFB confirmed |
| Budget-certain annual planning | InterServer | No renewal price change at any tier |
| Windows ASP.NET VPS | InterServer | Windows VPS available; UltaHost not confirmed |
| Custom hardware colocation | InterServer | Only option in this comparison |
| Enterprise DDoS without extra cost | UltaHost | BitNinja included; InterServer basic only |
Final Verdict
InterServer’s price lock is real and rare. No other provider in this comparison series guarantees identical renewal pricing across all tiers without exception. For a budget-constrained team running a low-traffic site, the permanent price lock has genuine long-term financial value.
But the performance data is clear. InterServer’s 4.4% load test reachability means the server fails under concurrent pressure. Its 8.7 second desktop LCP and 2.4 second mobile TTFB reflect an infrastructure ceiling that cannot be addressed with configuration changes. These are hardware and architecture limitations.
UltaHost’s 80ms mobile INP is the best in the series. Its 35ms US TTFB is excellent. It passes all mobile Core Web Vitals. It handles concurrent load at 98.6% reachability with a convincing BitNinja explanation for the 1,049ms average.
InterServer is best for: Low-traffic sites where budget certainty matters more than performance. Sites that need colocation, Windows VPS, or 25 years of brand history in one New Jersey data centre.
UltaHost is best for: Sites that need reliable performance under concurrent load, fast US server delivery, the best mobile Core Web Vitals compliance in this price tier, and enterprise DDoS protection included by default.
| Category | Winner |
|---|---|
| Mobile Core Web Vitals | UltaHost |
| Global TTFB | UltaHost |
| Desktop LCP | UltaHost |
| Concurrent Load | UltaHost |
| HTTP/3 | UltaHost |
| SSL | Tie |
| Uptime | Tie |
| Environmental | Tie |
| Price Lock | InterServer |
UltaHost wins five categories. InterServer wins one. Three are tied.
Tactical Recommendations
For InterServer: add full-page server-side caching before going live. The 2.4s mobile TTFB and 8.7s desktop LCP indicate the origin server struggles with dynamic page generation. Installing a full-page caching plugin (LiteSpeed Cache, W3 Total Cache, or WP Rocket) and setting aggressive browser caching headers reduces origin hits significantly. For a low-traffic blog or portfolio, this can bring load times to an acceptable range without server upgrades.
For UltaHost: BitNinja does not affect real visitors — test with real browsers. The 1,049ms K6 load test average is caused by BitNinja challenging synthetic automated traffic from cloud-based testing tools. If you want to benchmark your UltaHost VPS, use a real browser-based testing tool like GTmetrix, PageSpeed Insights, or WebPageTest rather than cloud-based synthetic load generators. These tools use real browser sessions that pass BitNinja’s verification. Your actual visitor experience will be significantly faster than K6-measured averages suggest.
For InterServer VPS: configure server-side caching on the LiteSpeed or Nginx layer. InterServer’s VPS plans give root access. On a self-managed VPS, configuring Nginx FastCGI caching or installing LiteSpeed with the LiteSpeed cache module reduces the per-request server processing that causes the slow TTFB. The 137ms response time for connected users in the load test suggests the server hardware can respond quickly once the connection is established. Caching reduces the processing overhead on each request.
Both providers: enable HSTS to reach SSL Grade A+. Both providers hold Grade B SSL. Enabling HSTS in the server configuration and verifying TLS 1.2 and 1.3 only are accepted upgrades both to Grade A. Adding a long max-age HSTS header with preload qualification reaches Grade A+. This is a one-time server configuration step on both platforms.
Frequently Asked Questions
Is InterServer’s price lock real?
Yes, it is genuine. InterServer has maintained its price lock policy for years. The price you pay at signup is the price you pay at every renewal, with no introductory period. This applies to shared hosting, VPS, and dedicated server plans. No other provider in this comparison series offers an equivalent guarantee across all plan tiers.
Why does InterServer have only 4.4% reachability under load?
The K6 load test sends 50 simultaneous virtual users to the server. InterServer’s origin server infrastructure was unable to handle the concurrent request volume — 95.6% of requests timed out or returned errors. This is not a WAF or security filter explanation. The server itself was the bottleneck. For a live site receiving simultaneous visitors from a promotional campaign or social media link, this level of concurrent handling is a significant reliability risk.
Is UltaHost’s 1,049ms load test result bad?
In isolation, 1,049ms is high. In context, it is explained by BitNinja DDoS protection flagging K6 Load Cloud as potential bot traffic. K6 runs synthetic automated HTTP requests from cloud infrastructure. BitNinja identifies this pattern as bot-like and challenges or rate-limits those requests. The server maintained 100% uptime throughout the test. Real visitors using actual browsers — which pass bot verification — are unaffected. The 98.6% reachability figure reflects that 1.4% of test probes were blocked by the bot filter, not that 1.4% of visitors experienced server errors.
Which is better for a WooCommerce store?
UltaHost. WooCommerce stores generate concurrent authenticated sessions during browsing, add-to-cart, and checkout. These bypass full-page caching and create real origin server load. InterServer’s 4.4% reachability under the concurrent test directly models this scenario. UltaHost’s 98.6% reachability and LiteSpeed + NVMe stack handle concurrent authenticated traffic far more reliably.
Does InterServer offer a money-back guarantee?
InterServer offers a 30-day money-back guarantee on shared hosting plans. VPS and dedicated server terms differ. The price lock begins from your first payment and carries through all subsequent renewals regardless of the guarantee window.
Which has better support?
InterServer offers more support channels, including 24/7 phone support on standard plans. UltaHost offers live chat and ticket support. For teams that need guaranteed phone escalation when a server issue occurs, InterServer’s support model is more accessible. For teams comfortable with chat and tickets, both providers are comparable on response accessibility.
Which is faster in the United States?
UltaHost by a large margin on verified measurements. UltaHost’s KeyCDN test returns 35ms TTFB in San Francisco and 45ms in New York — actual full-content delivery times. InterServer’s Check-Host test returns sub-2ms ping times to Cloudflare CDN edge nodes, but the real origin server response is indicated by the 2.4s mobile TTFB field data from PageSpeed Insights.