
Most server monitoring setups have the same problem.
They collect hundreds of metrics. They alert on CPU above 80%. They show beautiful dashboards. And then a site goes down at 2am because disk inodes ran out, which none of the dashboards tracked.
The problem is not the tools. The problem is metric selection.
There is a difference between metrics you can collect and metrics you should watch. Collecting more data does not make you more informed. Watching the right signals does.
This guide identifies the metrics that actually predict or confirm server problems. For each one, you get the exact command to check it, the threshold that matters, and what action it should trigger. By the end, you will know which dashboards to build, which alerts to set, and which numbers to ignore.
Key Takeaways
- Monitoring strategy matters more than monitoring tools
- Averages hide problems. Percentiles and saturation metrics reveal them
- CPU percentage is overrated as a primary alert. Load average and iowait tell you more
- Disk inodes fill up silently. Most teams discover this only after a service crashes
- The OOM killer is the most common cause of silent service failures. Almost nobody watches for it
- External monitoring from outside the server is not optional. Internal monitoring cannot detect what the server cannot see
- Every alert must have a corresponding action. An alert without an action is noise
The Framework: What to Actually Monitor
Before specific metrics, understand the framework that guides which metrics matter.
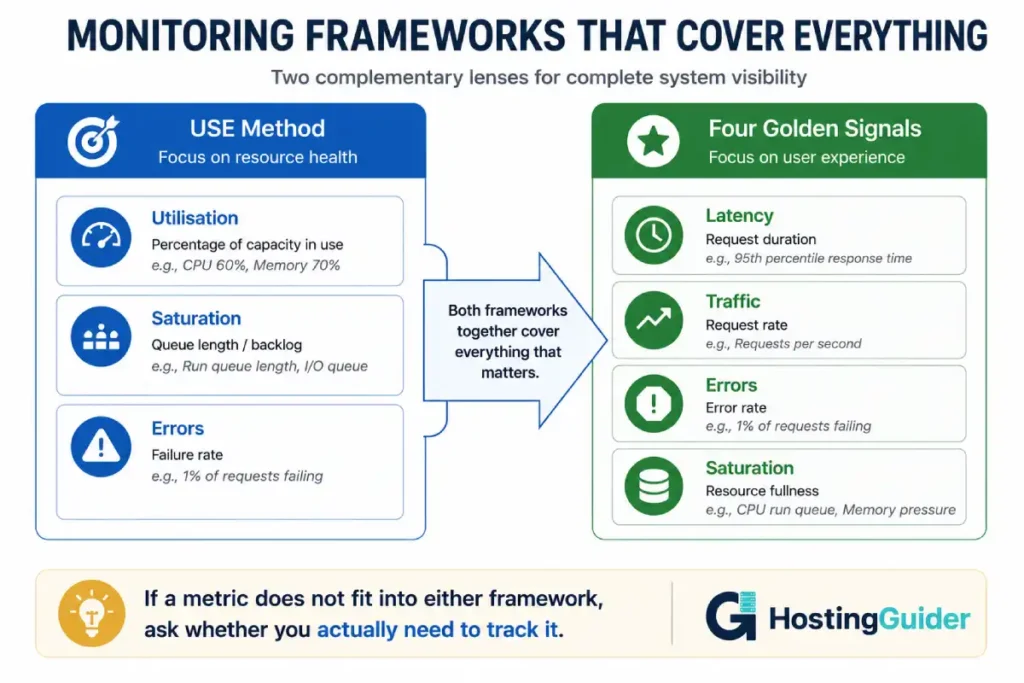
Site Reliability Engineers use two complementary models for deciding what to monitor.
The USE Method covers system resources:
- Utilisation: How busy is the resource?
- Saturation: Is work queuing up because the resource is too busy?
- Errors: Is the resource producing failures?
The Four Golden Signals cover user-facing behaviour:
- Latency: How long do requests take?
- Traffic: How many requests per second?
- Errors: What percentage of requests fail?
- Saturation: How full is the system?
Apply both frameworks to your dedicated server. For each resource (CPU, disk, network, database), ask all seven questions. The answers tell you what to measure.
The Metrics That Actually Matter
CPU Metrics
Most teams alert on CPU percentage and miss the metrics that actually matter.
CPU iowait
iowait is the percentage of time the CPU spends waiting for disk I/O to complete.
A CPU at 90% user time is busy doing work. A CPU at 90% iowait is stuck waiting for disk. These look identical in a simple CPU percentage chart. They require completely different responses.
Check it:
vmstat 5 5
Look at the wa column (I/O wait). Values consistently above 20% indicate a disk I/O bottleneck. The fix is faster storage or query optimisation, not more CPU.
Alert threshold: Average iowait above 20% for 5 consecutive minutes.
CPU steal time
Steal time appears only on virtualised servers and cloud instances, including most dedicated servers running any form of virtualisation. It measures how much CPU time the hypervisor gave to other VMs instead of yours.
Steal above 5% means you are not getting the resources you paid for.
Check it:
vmstat 5 5
Look at the st column. On bare metal dedicated servers, this is zero. On any virtualised environment, non-zero steal indicates a problem with the underlying hardware.
Alert threshold: Any steal above 5% sustained for over 5 minutes.
Load Average vs CPU Count
Load average measures the average number of processes waiting for CPU over 1, 5, and 15 minutes. The raw number is only meaningful relative to the number of CPUs.
Check it:
cat /proc/loadavg
nproc
If load average divided by CPU count is greater than 1.0, the system has more processes wanting CPU than cores available. Work is queuing.
# Quick check: is load/cpus > 1?
echo "scale=2; $(cut -d' ' -f1 /proc/loadavg) / $(nproc)" | bc
A value above 1.0 means saturation. A value above 2.0 means significant saturation. A value above 4.0 means the server is severely overloaded.
Alert threshold: load_average_1min / cpu_count above 2.0 for over 5 minutes.
CPU Frequency Scaling (Throttling)
Modern CPUs throttle their clock speed when overheating or when power saving is active. Throttling silently degrades performance without raising CPU percentage.
Check it:
cat /sys/devices/system/cpu/cpu0/cpufreq/scaling_cur_freq
cat /sys/devices/system/cpu/cpu0/cpufreq/scaling_max_freq
If the current frequency is significantly lower than the maximum, the CPU is throttling.
Alert threshold: CPU frequency below 80% of maximum for more than 5 minutes.
Memory Metrics
Total memory usage percentage is the wrong primary metric. What matters is available memory and swap behaviour.
Memory Available (Not Just Used)
Linux aggressively uses free RAM for disk caching. A server showing 90% memory used may have 80% of that as cache, meaning there is plenty of real free memory available.
The right metric:
free -m
Look at the available column, not the used column. Available shows how much memory can be allocated to new processes without swapping.
Alert threshold: Available memory below 20% of total RAM, sustained for more than 10 minutes.
Swap Usage Rate of Change
The current amount of swap in use is less important than how quickly it is growing. A server with 500MB of swap used that has been stable for days is fine. A server that increased swap usage by 200MB in the last hour is heading toward a crash.
Check rate of change:
watch -n 5 "free -m | grep Swap"
Watch the used column change over 5-minute intervals. Fast growth in either direction signals a memory problem.
Alert threshold: Swap usage increasing by more than 100MB in any 5-minute period.
OOM Killer Events
When the server runs out of memory, the Linux kernel kills processes to recover it. This is the OOM (Out of Memory) killer. The process it kills is often MySQL or PHP-FPM. The server does not crash. The site goes down silently.
Almost nobody monitors for OOM events. Every team should.
Check it:
sudo dmesg | grep -i "out of memory\|oom_kill\|killed process" | tail -20
sudo journalctl -k -p err | grep -i "oom\|killed" | tail -20
An OOM event in the last 24 hours means the server needed to kill a process to survive. That is a warning that needs investigation even if everything appears normal now.
Alert threshold: Any OOM event. Zero tolerance. Each one is actionable.
When a server crashes at 2am, OOM is responsible for a significant proportion of incidents. Monitoring for it closes this gap.
Disk Metrics
Disk problems have two failure modes: capacity and performance. Both need monitoring. One common failure mode is almost always ignored.
Disk Space Remaining
The obvious metric. But watch percentage remaining, not absolute bytes remaining, because a 1TB disk at 95% full is more dangerous than a 20GB disk at 70% full.
Check it:
df -h
Alert thresholds:
- Warning: Below 20% free
- Critical: Below 10% free
- Emergency: Below 5% free (services may start failing)
Inode Usage
This is the metric nobody monitors until it causes an outage.
Every file on Linux requires an inode. The filesystem has a fixed number of inodes, set at format time. Creating millions of small files (email queues, PHP session files, cache files, log fragments) can exhaust inodes while disk space shows as abundant.
When inodes run out, you cannot create new files. The server cannot write logs. PHP cannot create session files. Email cannot queue. Services fail with errors like No space left on device even though df -h shows free space.
Check it:
df -i
Look at the IUse% column. This is inode usage percentage.
# Find directories with most files
find / -xdev -type f 2>/dev/null | awk -F/ '{print "/"$2"/"$3}' | sort | uniq -c | sort -rn | head -20
Alert threshold: Inode usage above 80% on any filesystem.
Disk I/O Utilisation
Disk throughput (bytes per second) tells you how busy the disk is. Disk utilisation percentage tells you whether the disk is saturated.
Check it:
iostat -x 5 5
Look at the %util column. This is the percentage of time the disk was busy. Values consistently above 80% mean the disk is saturated. Requests are queuing.
Also watch await (average I/O wait time in milliseconds). Values above 20ms indicate latency problems.
Alert thresholds:
%utilabove 80% for more than 5 minutesawaitabove 20ms for more than 5 minutes
Network Metrics
Bandwidth Saturation
Your server’s network interface has a maximum throughput. Approaching that limit causes packet drops and connection failures.
Check it:
iftop -i eth0
Or for a non-interactive view:
cat /proc/net/dev | grep eth0
sleep 5
cat /proc/net/dev | grep eth0
Calculate bytes transferred in those 5 seconds and multiply by 8 for bits per second. Compare against your interface speed.
For persistent bandwidth monitoring, install and configure vnstat:
sudo apt install vnstat -y
sudo vnstat -l -i eth0
Alert threshold: Sustained bandwidth above 80% of interface capacity.
TCP Connection State Distribution
The distribution of TCP connection states reveals problems that bandwidth metrics miss.
Check it:
ss -s
This shows the count of connections in each TCP state. Three states deserve attention:
TIME_WAIT accumulation: Sockets waiting for the two-minute timeout after connection close. High TIME_WAIT (tens of thousands) indicates connection churn. The fix is enabling tcp_tw_reuse.
SYN-RECV accumulation: Connections in the SYN handshake stage that never complete. Sustained high SYN-RECV indicates either a SYN flood attack or clients with poor connectivity.
CLOSE-WAIT accumulation: Open connections that the remote end closed but the application has not. CLOSE-WAIT buildup indicates an application bug. The application is not closing connections properly.
Alert thresholds:
- TIME_WAIT above 50,000
- SYN-RECV above 1,000
- CLOSE-WAIT above 500
Network Error Rate
Network errors indicate hardware problems, cable issues, or driver bugs.
Check it:
ip -s link show eth0
Look at the errors and dropped counters. Any non-zero and increasing values on a production server warrant investigation.
Alert threshold: Any network errors increasing at more than 1 per minute.
Application Metrics
System metrics tell you about the server. Application metrics tell you about what users experience.
HTTP Error Rate
The percentage of HTTP requests returning 5xx errors is the most direct user-facing signal.
Check it from Nginx logs:
sudo awk '{print $9}' /var/log/nginx/access.log | sort | uniq -c | sort -rn
The output shows request counts by HTTP status code. A healthy server shows mostly 200 and 301 responses.
For real-time error rate:
sudo tail -f /var/log/nginx/access.log | awk '{print $9}' | grep -E "^5"
Watching the terminal with this command shows every 5xx error in real time.
Alert threshold: More than 1% of requests returning 5xx errors over any 5-minute window.
Request Latency Percentiles
Average response time is a misleading metric. If 99% of requests respond in 100ms and 1% respond in 30 seconds, the average looks acceptable. The 1% represents real users having terrible experiences.
Monitor p95 and p99 latency.
Extract latency percentiles from Nginx logs:
sudo awk '{print $NF}' /var/log/nginx/access.log | sort -n | \
  awk 'BEGIN{c=0} {a[c++]=$1} END{
    print "p50: " a[int(c*0.50)]
    print "p95: " a[int(c*0.95)]
    print "p99: " a[int(c*0.99)]
    print "p999: " a[int(c*0.999)]
  }'
This requires access log format to include request time. Add $request_time to your Nginx log format:
log_format main '$remote_addr - $remote_user [$time_local] "$request" '
               '$status $body_bytes_sent "$http_referer" '
               '"$http_user_agent" $request_time';
Alert thresholds:
- p95 latency above 2 seconds
- p99 latency above 5 seconds
- Any single request above 30 seconds (potential stuck process)
Database Connection Pool Saturation
For MySQL/MariaDB, the connections metric is critical. Each open connection uses memory. Hitting the connection limit causes new connections to fail.
Check it:
mysql -e "SHOW STATUS LIKE 'Threads_connected';"
mysql -e "SHOW VARIABLES LIKE 'max_connections';"
Calculate utilisation:
mysql -e "SELECT
  VARIABLE_VALUE AS 'Current_Connections'
  FROM information_schema.GLOBAL_STATUS
  WHERE VARIABLE_NAME = 'Threads_connected'
  UNION
  SELECT VARIABLE_VALUE AS 'Max_Connections'
  FROM information_schema.GLOBAL_VARIABLES
  WHERE VARIABLE_NAME = 'max_connections';"
Alert threshold: Current connections above 80% of max_connections.
Also check for slow queries accumulating:
mysql -e "SHOW STATUS LIKE 'Slow_queries';"
Watch this count increase over time. Rapid increases mean queries are degrading.
Log-Based Signals
Some of the most important monitoring signals live in logs, not metrics dashboards.
Failed Authentication Attempts
Brute force attacks leave a clear signature in authentication logs.
Check it:
sudo grep "Failed password" /var/log/auth.log | tail -20
sudo grep "Invalid user" /var/log/auth.log | wc -l
For rate-based alerting:
sudo grep "Failed password" /var/log/auth.log | awk '{print $11}' | sort | uniq -c | sort -rn | head -10
This shows the top attacking IPs by attempt count. Fail2Ban should be blocking these. If you see thousands of attempts from the same IP, Fail2Ban may not be configured or working.
Alert threshold: More than 100 failed authentication attempts in any 10-minute window from a single IP.
Application Error Log Rate
The rate at which your error log is growing is a proxy for application health.
Check current error log growth rate:
# Check lines added in last minute
sleep 60 & old_count=$(wc -l < /var/log/nginx/error.log); wait; new_count=$(wc -l < /var/log/nginx/error.log); echo "New errors per minute: $((new_count - old_count))"
Alert threshold: More than 50 new error log lines per minute (adjust based on your baseline).
The Metrics That Waste Your Time
These metrics are commonly collected and rarely actionable. Monitor them if you must, but do not alert on them.
| Metric | Why It Is Noise |
|---|---|
| Total processes running | Rarely changes meaningfully. OOM events matter more |
| CPU percentage 5-minute average | Too smoothed to detect fast problems. Use load average instead |
| Total bytes sent/received | Needs context (baseline) to be meaningful. Use % of capacity |
| Total database queries | Volume without error rate is meaningless |
| NTP offset | Important to configure but boring to watch |
| Kernel version | Set up auto-updates and stop watching |
| Number of users logged in | Rarely indicates a problem |
| Uptime in days | High uptime is not an achievement, it is a prerequisite |
Setting Up Monitoring Tools
Quick Setup: Netdata
Netdata installs in one command and provides 2,000+ metrics out of the box. It covers everything in this guide with zero configuration.
bash <(curl -SsL https://my-netdata.io/kickstart.sh) --dont-wait
Access the dashboard on port 19999:
http://YOUR.SERVER.IP:19999
Netdata includes out-of-the-box alerts for most of the thresholds in this guide. Check and adjust them:
sudo nano /etc/netdata/health.d/
Alert files are in this directory. Each metric has configurable warning and critical thresholds.
Limitation: Netdata stores data locally and has a short retention window on the free version. For long-term trend analysis, you need persistent storage.
Production Setup: Prometheus + Grafana
For serious production monitoring, Prometheus collects and stores metrics. Grafana visualises them. node_exporter exposes Linux metrics in Prometheus format.
Install node_exporter:
wget https://github.com/prometheus/node_exporter/releases/latest/download/node_exporter-1.7.0.linux-amd64.tar.gz
tar xvf node_exporter-*.tar.gz
sudo cp node_exporter-*/node_exporter /usr/local/bin/
Create a systemd service:
sudo nano /etc/systemd/system/node_exporter.service
Paste:
[Unit]
Description=Node Exporter
After=network.target

[Service]
User=node_exporter
Group=node_exporter
Type=simple
ExecStart=/usr/local/bin/node_exporter
Restart=always

[Install]
WantedBy=multi-user.target
Create the user and start the service:
sudo useradd -rs /bin/false node_exporter
sudo systemctl daemon-reload
sudo systemctl enable node_exporter
sudo systemctl start node_exporter
node_exporter now exposes metrics at http://YOUR.SERVER.IP:9100/metrics.
Install Prometheus on a separate monitoring server:
wget https://github.com/prometheus/prometheus/releases/latest/download/prometheus-2.48.0.linux-amd64.tar.gz
tar xvf prometheus-*.tar.gz
sudo cp prometheus-*/prometheus /usr/local/bin/
sudo cp prometheus-*/promtool /usr/local/bin/
Configure scraping in /etc/prometheus/prometheus.yml:
global:
  scrape_interval: 15s

scrape_configs:
  - job_name: 'dedicated_server'
    static_configs:
      - targets: ['YOUR.SERVER.IP:9100']
Install Grafana:
Add the Grafana repository and install:
sudo apt install -y software-properties-common
wget -q -O - https://packages.grafana.com/gpg.key | sudo apt-key add -
sudo add-apt-repository "deb https://packages.grafana.com/oss/deb stable main"
sudo apt update
sudo apt install grafana -y
sudo systemctl enable grafana-server
sudo systemctl start grafana-server
Access Grafana at port 3000. Connect Prometheus as a data source. Import dashboard ID 1860 from the Grafana dashboard library — this is the Node Exporter Full dashboard and covers most metrics in this guide out of the box.
External Monitoring
Internal monitoring cannot detect what the server cannot see. If Nginx crashes and takes monitoring with it, no alert fires. External monitoring is not optional.
UptimeRobot provides free external monitoring checking every 5 minutes. Set up HTTP monitors for every domain on your server.
Healthchecks.io provides cron job monitoring. Add a curl call to the Healthchecks URL at the end of every cron script. If the script does not complete and call home, you receive an alert.
Add to your backup cron:
/usr/local/bin/backup.sh && curl -fsS "https://hc-ping.com/YOUR-CHECK-UUID" > /dev/null
If the backup script fails before this line, the ping never fires. Healthchecks alerts you after the expected ping window passes.
Alert Thresholds Reference
This table consolidates all thresholds from this guide into a single reference.
| Metric | Warning | Critical | Action |
|---|---|---|---|
| CPU iowait | 15% for 5 min | 30% for 5 min | Investigate disk I/O, check slow queries |
| CPU steal | 3% for 5 min | 10% for 5 min | Contact provider, check hardware |
| Load / CPU count | 1.5 for 5 min | 3.0 for 5 min | Identify CPU consumers with htop |
| Memory available | 25% remaining | 15% remaining | Investigate memory growth, check for leaks |
| Swap usage change | +50MB in 5 min | +200MB in 5 min | Identify memory consumers, consider adding RAM |
| OOM events | Any single event | 2+ events in 1 hour | Restart killed service, investigate memory |
| Disk space | 20% remaining | 10% remaining | Clean logs, expand storage |
| Inode usage | 80% | 90% | Find directories with many small files |
| Disk I/O %util | 70% for 5 min | 85% for 5 min | Check for runaway I/O processes |
| Disk await | 15ms | 30ms | Investigate I/O patterns, check hardware |
| HTTP 5xx rate | 0.5% of requests | 2% of requests | Check application error logs |
| p99 request latency | 3 seconds | 8 seconds | Profile slow requests |
| DB connection % | 70% of max | 85% of max | Tune max_connections, check for connection leaks |
| Auth failures | 50 per IP/10 min | 200 per IP/10 min | Verify Fail2Ban is active |
The Daily Monitoring Routine
Alerts catch acute problems. A daily review catches gradual degradation before it becomes critical.
These five checks take under three minutes each morning:
Check 1: Disk space trends
df -h && df -i
Note the percentage. If it increased more than 1% since yesterday, investigate what is growing.
Check 2: OOM events since last check
sudo dmesg --since "24 hours ago" | grep -i "oom\|killed process"
Any output here is actionable regardless of whether the site seems fine.
Check 3: Service health
sudo systemctl list-units --type=service --state=failed
Failed services that recovered via restart appear here. A service that restarted twice last night is a problem even if it is currently running.
Check 4: Error log rate
sudo wc -l /var/log/nginx/error.log
sudo wc -l /var/log/php_errors.log
Keep a note of these counts. Rapid increase since yesterday means a new error pattern has emerged.
Check 5: Authentication log check
sudo grep "Failed password" /var/log/auth.log | awk '{print $11}' | sort | uniq -c | sort -rn | head -5
The top attacking IPs and their attempt counts. If the same IP appears daily with thousands of attempts, add it to a permanent block list.
Monitoring Managed Hosting vs Self-Managed
If you manage your own dedicated server, everything in this guide is your responsibility.
If you use managed cloud hosting, your provider handles most system-level monitoring. Cloudways monitors server CPU, memory, and disk and alerts you before thresholds are breached. ScalaHosting includes SShield, which monitors for security anomalies in real time. Kinsta monitors uptime and performance and alerts you before problems affect visitors.
With managed hosting, your monitoring responsibility shifts from infrastructure metrics to application metrics. You watch HTTP error rates, request latency, and database performance. The provider watches everything below that layer.
Understanding what your provider monitors and what they do not informs what you still need to watch yourself.
Frequently Asked Questions
What is the single most important metric to monitor?
It depends on your stack. For most web application servers, the single most impactful metric is HTTP 5xx error rate. This directly represents the percentage of your visitors experiencing failures. Everything else (CPU, memory, disk) is a cause. The 5xx rate is the symptom. Monitoring both causes and symptoms is ideal, but if you can only watch one number, watch the failure rate that your users experience.
How often should metrics be collected?
For most metrics, 15-second intervals provide good resolution without excessive storage overhead. This is what Prometheus uses by default. For very fast-moving metrics like TCP connection states during a DDoS attack, 5-second or 1-second collection reveals patterns that 15-second averages smooth over. For disk space and inodes, 5-minute collection is sufficient because these change slowly. Match collection frequency to how fast the metric can change meaningfully.
What is the difference between a metric and a log?
Metrics are numeric measurements at a point in time. CPU was 74.3% at 14:32:15. Logs are text events. User 4821 failed login from IP 203.0.113.50 at 14:32:17. Metrics answer questions like how much and how often. Logs answer questions like what happened and who did it. Both are necessary for complete server visibility. Metrics are better for alerting on thresholds. Logs are better for investigating specific incidents after an alert fires.
How many alerts should I have active?
Enough to catch every category of problem, not one for every metric you collect. A reasonable production setup has 10-15 active alerts: one or two each for CPU, memory, disk, network, application errors, and external availability. More than 30 alerts typically produces alert fatigue. Engineers start ignoring alerts because so many fire. Each alert must have a corresponding documented action. If you cannot write down what to do when an alert fires, do not create the alert yet.
Should I monitor the dedicated server from inside the server itself?
Yes, but not only from inside. A monitoring system running on the server it monitors has a blind spot: if the server itself goes down, the monitoring system goes down with it and no alert fires. Internal monitoring (Netdata, Prometheus node_exporter) provides high-resolution metric detail. External monitoring (UptimeRobot, Healthchecks.io) provides the safety net that fires when internal monitoring cannot. You need both.
What should I do when the site is down but all metrics look normal?
This happens when the problem is at the application layer rather than the infrastructure layer. All system metrics (CPU, memory, disk) look fine because the system is healthy. But the application has a bug, the database has a corrupted table, or a plugin entered an infinite loop that holds database connections without using CPU. Start with the application error log and the slow query log. Check SHOW PROCESSLIST in MySQL for stuck queries. Check ss -s for unexpected socket state accumulation.