
It is 2:13 AM. Somewhere in a data centre, a process died. A kernel logged a panic. A disk stopped responding.
Your website is now returning a 502 error to everyone who visits it.
You are asleep.
This happens every night across thousands of servers worldwide. What follows the crash, and how quickly your site recovers, depends entirely on what type of hosting you are on, what monitoring you have, and how your infrastructure handles failure.
This article walks through exactly what happens, step by step. It covers everything from a basic shared hosting account to a multi-region cloud setup. Every concept is explained plainly. Real diagnosis commands are included. Whether you are running a personal blog or managing production infrastructure, there is something concrete here for you.
Key Takeaways
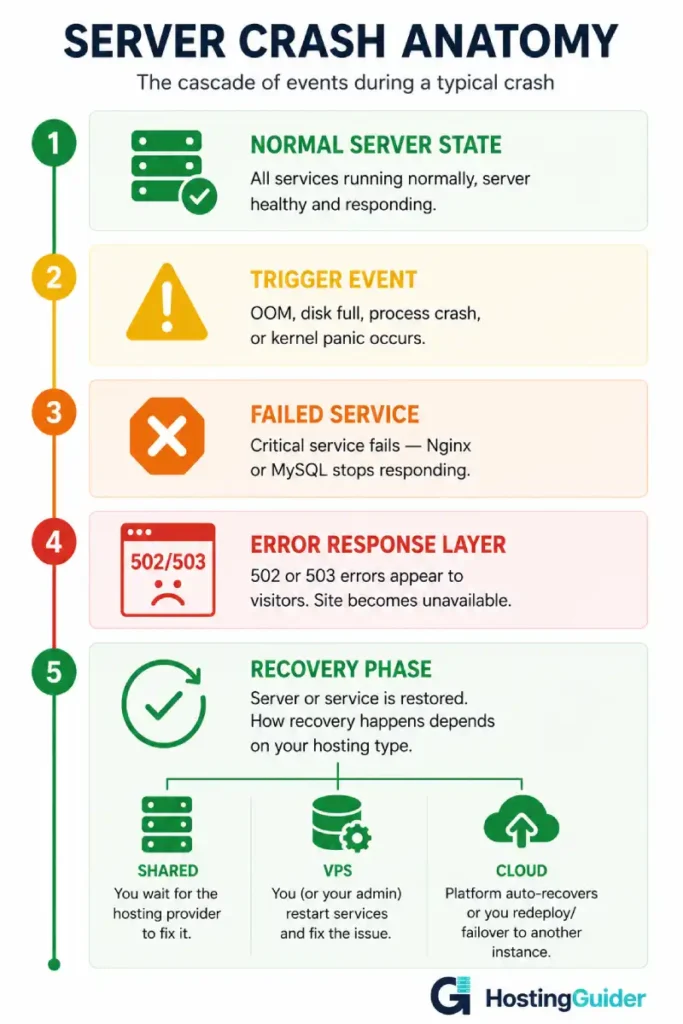
- A server crash is not one event. It is a cascade of smaller failures, each with a specific cause
- The gap between when your site goes down and when you know about it can be hours without monitoring
- RTO and RPO determine how painful a crash actually is for your business
- On shared hosting you wait. On unmanaged VPS you respond. On cloud infrastructure, automation responds before you even wake up
- The OOM killer, kernel panics, disk failures, and process crashes are four different problems with four different fixes
- Post-mortem culture is what separates teams that improve from teams that repeat the same incidents
What a Server Crash Actually Means
Most people think a crash means the server exploded.
It did not. The physical hardware is almost always fine.
A server crash means the software running on that server entered a state it could not recover from on its own. This could be Linux running out of memory. It could be a disk filling up completely. It could be a process like Nginx or MySQL exiting unexpectedly. It could be a kernel bug that forced a panic and reboot.
The server is a computer. Computers hit resource limits, encounter bad states, and stop responding. The question is not whether this will happen. The question is how your hosting setup responds when it does.
Think of it like a restaurant kitchen. A crash is not the building burning down. It is the head chef collapsing during dinner service. The kitchen is still there. The food is still there. But nothing is going out to the tables until someone steps in.
The Four Most Common Types of Server Crashes
Understanding the type of crash is the first step in diagnosing it. Each type leaves different traces and needs a different fix.
1. Out of Memory (OOM) Crash
The Linux kernel manages memory carefully. When RAM fills up completely, the kernel runs a process called the OOM Killer.
The OOM Killer looks at all running processes and kills the one using the most memory. This is usually MySQL or PHP-FPM on a WordPress server.
The server does not go offline. The server is still running. But MySQL is dead. Every request that needs the database returns an error. Your site looks down even though the machine is technically online.
Plain analogy: Imagine a restaurant that can seat 50 people. 60 people arrive. The manager starts sending people home. The restaurant is still open but some of your guests just got ejected.
You can see OOM events in the kernel log:
sudo dmesg | grep -i "out of memory"
sudo dmesg | grep -i "killed process"
A real OOM log entry looks like this:
Out of memory: Kill process 4823 (mysqld) score 247 or sacrifice child
Killed process 4823 (mysqld) total-vm:1843200kB, anon-rss:512000kB
That tells you exactly what was killed and why.
2. Disk Full Crash
When your disk reaches 100%, the server cannot write anything.
MySQL cannot write new rows. Nginx cannot write access logs. PHP cannot create temporary files. WordPress cannot save anything. Every write operation fails silently or with an error.
The server is online. Your site is returning errors. And the root cause is a log file that grew to 40GB in the background over three weeks.
Check disk usage:
df -h
Find what is consuming the space:
sudo du -sh /var/log/* 2>/dev/null | sort -rh | head -20
Nine times out of ten, logs are the culprit on a VPS that fills up unexpectedly.
3. Kernel Panic
A kernel panic is Linux’s equivalent of a Windows blue screen.
The kernel encountered a condition so severe it could not continue safely. This is rare on modern Linux systems but it happens. Hardware memory errors, certain driver bugs, and corrupted kernel modules can all trigger it.
When a kernel panic occurs, the server freezes completely and reboots. Depending on the cause, it may come back clean. Or it may panic again during boot.
Check the kernel ring buffer after a reboot:
sudo dmesg | grep -i panic
sudo journalctl -k -p err
A panic log looks like:
Kernel panic - not syncing: VFS: Unable to mount root fs on unknown-block(0,0)
That specific message points to a filesystem or storage problem.
4. Process Crash
This is the most common and most fixable type.
Nginx dies. MySQL crashes. PHP-FPM exits. The server is completely healthy. One critical process stopped running. All traffic that depends on that process now gets errors.
Check which services have failed:
sudo systemctl list-units --type=service --state=failed
Check what Nginx last logged before dying:
sudo tail -100 /var/log/nginx/error.log
Check MySQL:
sudo tail -100 /var/log/mysql/error.log
Most process crashes leave a clear error message. Finding it takes two minutes. Fixing it usually takes five.
The Incident Timeline: Minute by Minute
Here is a real crash incident broken down by what happens at each minute. This is based on a standard unmanaged VPS running WordPress with no auto-recovery.
| Time | What Happens |
|---|---|
| 2:00 AM | MySQL OOM killed. Every database query fails. Site returns 502 |
| 2:00 AM | First visitor hits the error. Leaves immediately |
| 2:00 – 2:47 AM | Site is down. Owner is asleep. No monitoring |
| 2:47 AM | Owner wakes up to use the bathroom, checks phone |
| 2:48 AM | Owner sees a message from a reader: your site is down |
| 2:49 AM | Panic. Owner opens laptop |
| 2:51 AM | SSH into server. Runs systemctl status nginx |
| 2:52 AM | Nginx is running. Runs systemctl status mysql |
| 2:53 AM | MySQL: inactive (dead). Root cause found |
| 2:54 AM | Restarts MySQL: sudo systemctl restart mysql |
| 2:55 AM | MySQL starts. Site comes back online |
| 2:55 AM | 55 minutes of downtime. All from a problem that took 60 seconds to fix |
That 47-minute gap between the crash and the first awareness is not the server’s fault. It is a monitoring failure.
With a free tool like UptimeRobot sending an alert the moment the site stops responding, the owner wakes up at 2:05 AM. The total downtime drops from 55 minutes to 8 minutes.
The real cost of that gap is covered in our uptime importance guide. For a site generating any revenue, 55 minutes of downtime has a measurable financial cost every single time it happens.
What Happens at Each Hosting Level
The same MySQL crash produces a completely different experience depending on what type of hosting you are on.
Shared Hosting: You Have No Control
On shared hosting, you share a server with hundreds of other websites. When that server crashes, you have zero visibility and zero control.
The hosting provider’s operations team receives the alert. They diagnose the problem. They fix it. They may communicate updates on a status page. You wait.
This is not entirely bad. You are not paying for the expertise to respond. The host is. A good shared host has a 24/7 operations team that handles this faster than most individuals could.
The problem is you are also sharing the server with hundreds of other sites. When one of those sites causes an OOM event, your site suffers for the crash someone else caused.
What you can do on shared hosting:
- Set up UptimeRobot or similar to alert you when your site goes down
- Monitor your host’s status page during incidents
- Check their uptime SLA and understand what compensation applies
- Have a static backup page that can serve from a CDN if your site goes fully offline
What you cannot do:
- SSH into the server and diagnose
- Restart crashed services
- See the actual error logs from the server
- Control when the fix happens
Shared hosting explained in detail covers what you are and are not responsible for on a shared account.
Unmanaged VPS: You Are the SRE
On an unmanaged VPS, you have full control. You also have full responsibility.
The crash happens at 2:00 AM. Your monitoring fires at 2:01 AM. You are the one who gets up, diagnoses, and fixes it.
This is where the real SRE work begins.
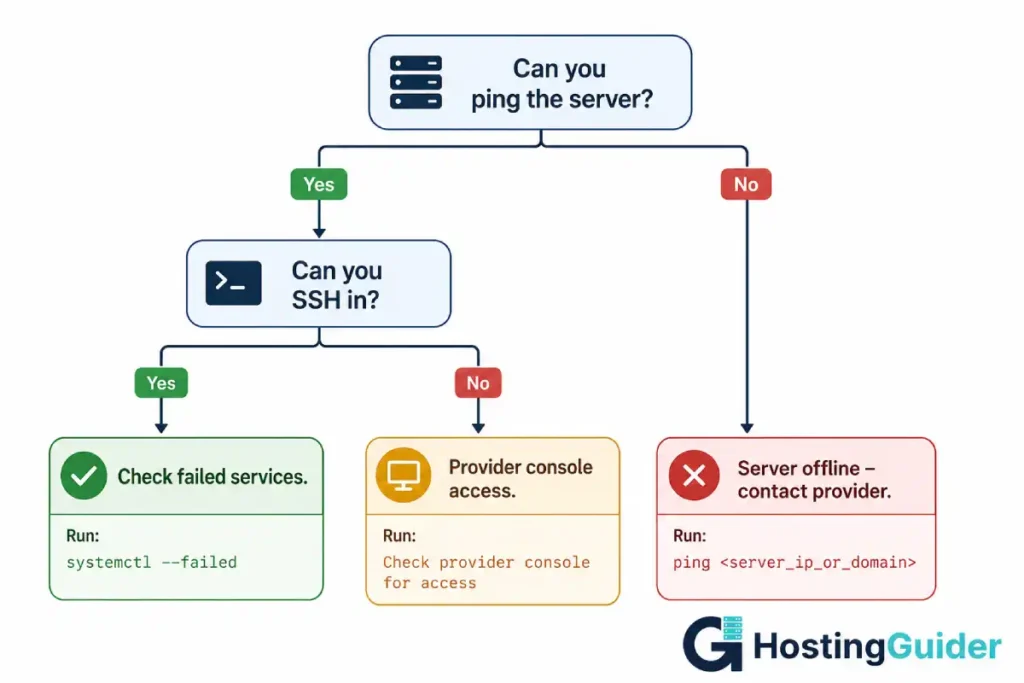
The diagnosis sequence for an unmanaged VPS:
Step 1. First, confirm the server is reachable:
ping 203.0.113.50
If ping responds but the site does not, the server is up but a service died. If ping does not respond, you have a deeper problem.
Step 2. SSH in:
ssh yourname@203.0.113.50
If SSH hangs or refuses, the server may have OOM killed the SSH daemon, or the server rebooted and is still coming up.
Step 3. Check for failed services immediately:
sudo systemctl list-units --type=service --state=failed
Step 4. Check system-level error logs:
sudo journalctl -p err -n 100
Step 5. Check memory right now:
free -m
cat /proc/meminfo | grep -E "MemAvailable|SwapFree"
Step 6. Check disk:
df -h
Step 7. Check what the OOM killer did in the recent past:
sudo dmesg | grep -E "oom|killed|panic" | tail -30
Step 8. Check the processes currently running:
ps aux --sort=-%mem | head -20
Step 9. Once you identify the dead service, restart it:
sudo systemctl restart mysql
sudo systemctl restart nginx
sudo systemctl restart php8.1-fpm
Step 10. Verify the site is back:
curl -I https://yourdomain.com
A healthy response looks like:
HTTP/2 200
server: nginx
content-type: text/html; charset=UTF-8
A bad response looks like:
curl: (7) Failed to connect to yourdomain.com port 443: Connection refused
When the commands above point to a specific service failure, the exact fix for every common VPS crash is in the troubleshooting guide.
Managed VPS and Managed WordPress: The Host Wakes Up
On managed VPS and managed WordPress hosting, the operational responsibility shifts.
The host runs 24/7 monitoring on your server. When MySQL crashes at 2:00 AM, their systems detect it within seconds. An alert fires to their on-call team. A technician investigates and restores the service.
You find out about it from your UptimeRobot alert and then see the incident update on their status page.
Providers like Cloudways monitor server health continuously. ScalaHosting includes SShield, which monitors and blocks threats in real time. Kinsta runs on Google Cloud infrastructure with multiple redundancy layers and an operations team that responds within minutes.
The trade-off is control. On managed hosting, you cannot SSH in and run arbitrary commands on the server. The management layer removes that access in exchange for the management service.
For most site owners, this is a good trade. Running a WordPress blog does not require root server access. But developers with specific application requirements sometimes need that access.
The managed vs unmanaged VPS comparison explains exactly what each approach gives up and gains.
Cloud Infrastructure: The Machine Responds Before You Do
This is where the architecture changes fundamentally.
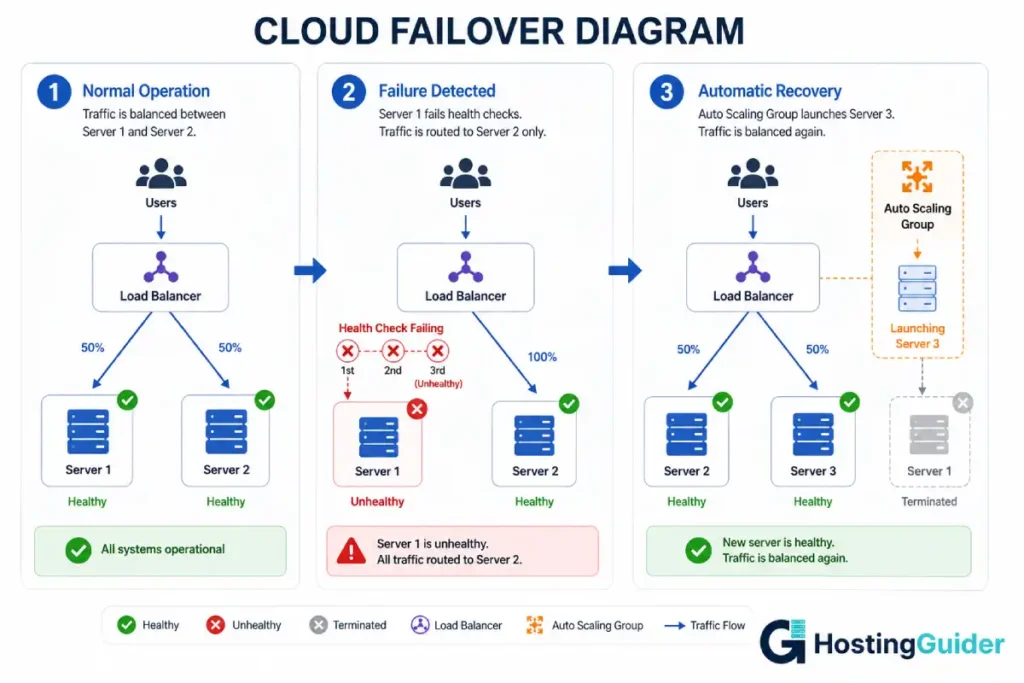
On a properly designed cloud setup, a single server crashing does not take your site offline. The infrastructure detects the failure and routes around it automatically.
Here is how it works in practice.
Health checks are requests sent by a load balancer to your servers every few seconds. A simple health check might look like this:
GET /health HTTP/1.1
Host: app-server-01.internal
Your application responds with:
HTTP/1.1 200 OK
{"status": "healthy"}
The load balancer expects this response every 10 seconds. If it misses three consecutive responses, it marks that server as unhealthy.
The failover sequence:
At 2:00 AM, MySQL crashes on Server 1. The application starts returning 502 errors.
At 2:00 AM + 30 seconds: The load balancer’s health check fails three consecutive times.
At 2:01 AM: The load balancer stops sending traffic to Server 1. All traffic now routes to Server 2.
At 2:01 AM: Visitors on your site notice nothing. The failover happened silently in the background.
At 2:05 AM: If you have auto-healing configured, the cloud platform terminates the unhealthy Server 1 instance and launches a replacement from a pre-configured image.
At 2:15 AM: The replacement server passes health checks. The load balancer adds it back to the rotation.
Total visitor-visible downtime: approximately 30 to 60 seconds during the brief failover window.
This architecture is what cloud hosting scalability actually means in practice. It is not just about handling more traffic. It is about handling failure gracefully.
SRE Concepts Every Hosting Customer Should Know
These terms appear in SLAs, status pages, and post-mortems. Understanding them helps you evaluate hosting providers honestly.
RTO: Recovery Time Objective
RTO is the maximum acceptable time for your site to be offline after a failure.
Plain analogy: Your laptop crashes and you need to keep working. How long can you afford to wait before you need to be productive again? If the answer is four hours, your RTO is four hours.
For a personal blog, an RTO of 4 hours might be fine. For an ecommerce store running a flash sale, an RTO of 60 seconds is barely acceptable.
Your hosting type must match your RTO requirement. A shared host with a 4-hour response SLA cannot meet a 60-second RTO. A cloud setup with automated failover can.
RPO: Recovery Point Objective
RPO is the maximum amount of data loss you can tolerate.
Plain analogy: You save your document every hour. Your computer crashes. You lose up to one hour of work. Your RPO is one hour.
For a WordPress blog with daily backups, your RPO is up to 24 hours of content. A post you published at 11pm that crashes at 1am could be lost entirely if your backup ran at midnight.
For a WooCommerce store, losing 24 hours of orders is catastrophic. The store needs backups every hour, or continuous replication. The RPO requirement drives the backup architecture.
| Business Type | Acceptable RTO | Acceptable RPO |
|---|---|---|
| Personal blog | 4 to 24 hours | 24 hours |
| Small business brochure site | 2 to 4 hours | 24 hours |
| Content site with ad revenue | 30 to 60 minutes | 4 to 12 hours |
| WooCommerce store | 5 to 15 minutes | 1 to 4 hours |
| SaaS or subscription platform | Under 5 minutes | Under 1 hour |
| Financial or healthcare platform | Under 60 seconds | Near-zero |
MTTR: Mean Time To Recovery
MTTR is the average time it takes to restore service after an incident.
A lower MTTR means your team or your hosting provider responds and fixes things faster.
Shared hosting: MTTR is the hosting provider’s response time. Could be 15 minutes. Could be 4 hours. Check their status page history.
Unmanaged VPS: MTTR is your own response time. If you wake up fast, diagnose fast, and fix fast, MTTR could be under 10 minutes. If you sleep through the alert, MTTR is several hours.
Managed hosting: MTTR is the provider’s 24/7 team response time. Kinsta and SiteGround both average under 2 minutes for live chat response. That is a proxy for MTTR.
Cloud with auto-healing: MTTR for common failures approaches zero because automation responds before a human is even paged.
SLA vs SLO
SLA (Service Level Agreement) is the contractual promise your hosting provider makes to you. If they breach it, you get compensation.
SLO (Service Level Objective) is the internal target an engineering team sets for itself. It is stricter than the SLA.
Example: A hosting provider’s SLA promises 99.9% uptime. Their internal SLO targets 99.95%. They absorb the gap as their safety buffer. If something goes wrong and they drop to 99.92%, they breached their SLO internally but not the customer-facing SLA.
As a customer, what matters is the SLA. Read it. Understand what triggers compensation. Understand what is excluded (scheduled maintenance, your own configuration errors, third-party failures).
Error Budget
An error budget is the amount of downtime your SLA allows before you breach it.
99.9% uptime allows 8 hours and 45 minutes of downtime per year. That is your error budget.
SRE teams track how much of this budget has been spent. When a team has used 80% of their annual error budget by September, the engineering focus shifts from shipping new features to improving reliability.
As a hosting customer, you do not manage an error budget. But understanding the concept helps you ask better questions. Ask your host: how much of your uptime SLA have you actually used in the past 12 months? Their status page should tell you.
Diagnosis Commands: The Full Reference
These commands work on any Linux VPS. Keep this list accessible for 2am situations.
Is the server responding at all?
ping YOUR.VPS.IP.ADDRESS
Is SSH working?
ssh yourname@YOUR.VPS.IP.ADDRESS
What services have failed?
sudo systemctl list-units --type=service --state=failed
What does the system error log say?
sudo journalctl -p err -n 100
sudo journalctl -p err --since "1 hour ago"
Did the OOM killer fire?
sudo dmesg | grep -i "out of memory"
sudo dmesg | grep -i "killed process"
Was there a kernel panic?
sudo dmesg | grep -i panic
sudo dmesg | tail -50
What is the current memory situation?
free -m
vmstat -s | head -10
What processes are consuming the most memory right now?
ps aux --sort=-%mem | head -20
What is the disk situation?
df -h
What is consuming the most disk space?
sudo du -sh /* 2>/dev/null | sort -rh | head -15
sudo du -sh /var/log/* 2>/dev/null | sort -rh | head -10
What does Nginx say?
sudo systemctl status nginx
sudo tail -50 /var/log/nginx/error.log
sudo nginx -t
What does MySQL say?
sudo systemctl status mysql
sudo tail -50 /var/log/mysql/error.log
Is the site responding from the server itself?
curl -I http://localhost
curl -I https://yourdomain.com
What is the full request path look like?
curl -v https://yourdomain.com 2>&1 | head -50
What ports are listening?
sudo ss -tlnp
Is anything consuming unusual CPU?
top -b -n 1 | head -20
How Automated Failover Works at Cloud Scale
This section goes deeper on the cloud failover mechanics described earlier.
A load balancer is a server whose only job is to receive incoming requests and forward them to one of your backend servers. It keeps a list of healthy backends. It updates that list continuously based on health check results.
AWS calls this an Application Load Balancer (ALB). GCP calls it a Cloud Load Balancing instance. Cloudflare’s network operates as a global load balancer in front of your origin. The concept is the same across providers.
A health check configuration looks like this (conceptually):
Health check path: /health
Protocol: HTTPS
Port: 443
Interval: 10 seconds
Healthy threshold: 2 consecutive successes
Unhealthy threshold: 3 consecutive failures
Timeout: 5 seconds
This means: check every 10 seconds. If a server fails 3 checks in a row (30 seconds total), mark it unhealthy. If it passes 2 checks in a row after that, mark it healthy again.
During those 30 seconds of failing checks before the failover, some requests may still reach the bad server and receive errors. This is the unavoidable minimum downtime window even on a well-architected cloud setup. Reducing it means more frequent health checks, which adds overhead.
Auto Scaling Group behaviour:
On AWS, an Auto Scaling Group watches for unhealthy instances. When it detects one, it terminates the instance and launches a replacement using a pre-configured AMI (Amazon Machine Image). The new instance bootstraps, starts services, and begins passing health checks. The load balancer adds it to rotation.
On GCP, the equivalent is a Managed Instance Group with autohealing.
On a managed cloud VPS like Cloudways, some of this is handled for you. The platform monitors server health and their team intervenes before automated recovery would be needed in most cases.
Traditional hosting ties your site to one physical machine. One hardware fault and your site is offline until someone physically intervenes.
Post-Mortem Culture: What Happens After the Crash
In professional SRE teams, every significant incident is followed by a post-mortem. This is not about blame. It is about understanding what happened and preventing recurrence.
A good post-mortem answers five questions:
What happened? MySQL was killed by the OOM killer at 02:13 AM. The site returned 502 errors for 55 minutes until the service was manually restarted.
Why did it happen? A poorly written WordPress plugin was running a query that held database connections open indefinitely. Over several hours, connection count grew until MySQL exhausted available memory.
How did we detect it? We did not detect it promptly. A reader reported it via direct message. Monitoring was not in place.
What did we do to fix it? Restarted MySQL. Identified the plugin through slow query logs. Deactivated the plugin.
What do we do to prevent recurrence? Set up UptimeRobot monitoring. Implement MySQL slow query logging permanently. Review plugin performance weekly using a staging environment.
This five-question framework applies equally to a solo blogger running one WordPress site and a team of ten engineers managing a production platform. The discipline of writing it down and acting on it is what prevents the same crash from happening again at 3am next month.
How to Protect Yourself at Every Level
If You Are on Shared Hosting
You cannot prevent server crashes. You can minimise their impact.
Set up free uptime monitoring with UptimeRobot. Know when your site goes down within five minutes, not 47 minutes.
Check your host’s status page. Bookmark it. This is where they post incident updates: Kinsta Status as an example.
Keep daily backups of your own. Do not rely only on your host’s backups. Use UpdraftPlus or similar to back up to external storage like Google Drive.
Understand your host’s SLA. Know what compensation you receive for downtime. SiteGround guarantees 99.99% uptime on its cloud plans. Standard shared plans typically promise 99.9%.
If You Are on an Unmanaged VPS
Set up monitoring before anything else. UptimeRobot for site-level. Something like Site24x7 for server-level metrics including CPU, RAM, and disk.
Configure automatic service restart. systemd can restart a crashed service automatically:
sudo nano /etc/systemd/system/nginx.service.d/override.conf
Add:
[Service]
Restart=always
RestartSec=5
This tells systemd to restart Nginx automatically if it crashes, with a 5-second delay between attempts.
Add swap space if your VPS has 1GB or 2GB of RAM. Swap is slower than RAM but prevents OOM kills during traffic spikes:
sudo fallocate -l 2G /swapfile
sudo chmod 600 /swapfile
sudo mkswap /swapfile
sudo swapon /swapfile
echo '/swapfile none swap sw 0 0' | sudo tee -a /etc/fstab
Set up log rotation to prevent disk-full crashes:
sudo nano /etc/logrotate.d/nginx
A standard nginx logrotate config:
/var/log/nginx/*.log {
    daily
    missingok
    rotate 14
    compress
    delaycompress
    notifempty
    sharedscripts
    postrotate
        nginx -s reopen
    endscript
}
Follow our VPS setup tutorial for a complete initial configuration that prevents most common crashes.
If You Are on Managed or Cloud Hosting
Your hosting provider handles most of the server-level protection. Your responsibility shifts to the application level.
Use a staging environment. Test every plugin update, theme change, and code change on staging before applying to production. One bad plugin is enough to cause an OOM crash.
Keep WordPress, plugins, and themes updated. A security vulnerability that gets exploited can inject malicious code that exhausts server resources and causes a crash.
Monitor your application performance. Tools like New Relic or Datadog show you which queries are slow, which pages use the most memory, and where bottlenecks are forming before they cause a crash.
Use a CDN. Cloudflare on its free tier caches your static content and continues serving it to visitors even during a brief origin server outage. Visitors may not even notice a short crash.
The security benefits of managed WordPress hosting include active monitoring and malware scanning that catch problems before they cascade into crashes.
Frequently Asked Questions
What is the first thing to do when your website goes down at 2am?
Do not panic and do not start changing things randomly. The sequence matters. First, confirm the site is actually down by testing from a different device or network. Second, check your hosting provider’s status page for a known incident. Third, if no incident is listed, try SSH. Fourth, run sudo systemctl list-units –type=service –state=failed to find the failed service. Fifth, check the error logs for that service. Restart it if it crashed. Diagnose why it crashed before going back to sleep so the same thing does not happen again in three hours.
What is the OOM killer and why does it kill MySQL?
The OOM killer is a Linux kernel mechanism that activates when the system runs completely out of memory. It cannot allow the kernel itself to crash, so it kills the process consuming the most memory to free resources. MySQL and PHP-FPM are frequently the targets because they are among the largest memory consumers on a typical web server. When MySQL gets killed, every page request that needs a database query fails. The site appears down even though the server is completely operational.
What is the difference between RTO and RPO?
RTO is how long your site can be offline before it significantly damages your business. RPO is how much data you can afford to lose. Think of RTO as the clock that starts ticking when your site goes down. Think of RPO as the gap between your last backup and the moment of the crash. If you back up daily and crash happens 23 hours after the last backup, you could lose 23 hours of data. Your infrastructure needs to match both requirements to protect you properly.
How does cloud hosting survive a server crash?
Cloud hosting uses multiple servers behind a load balancer. The load balancer sends health check requests to each server every few seconds. When one server starts failing health checks after a crash, the load balancer removes it from the rotation. Traffic continues flowing to the remaining healthy servers. Depending on the configuration, an auto-scaling system then launches a replacement server automatically. Visitors experience a brief degraded period while failover occurs, typically under 60 seconds, rather than a full outage.
Should I be on shared hosting if I run an ecommerce store?
No. Shared hosting does not provide the reliability, performance isolation, or response time that an ecommerce store needs. A flash sale driving 500 simultaneous visitors will overwhelm a shared server. An OOM crash at 2am caused by a neighbouring site will take your checkout offline during a sale. At minimum, an ecommerce store needs managed cloud hosting with dedicated resources, automated backups every few hours, and a provider with a documented incident response process. The difference in monthly cost is almost always less than the revenue from one hour of downtime.
What is a post-mortem and should I write one after a crash?
A post-mortem is a structured document that answers what happened, why it happened, how it was detected, how it was fixed, and what changes prevent recurrence. Professional SRE teams write them after every significant incident regardless of cause. Solo site owners benefit from the same discipline. Even a one-page note answering those five questions forces you to understand what actually went wrong rather than just restarting the service and hoping it holds. The act of writing it down consistently produces better outcomes than treating each crash as an isolated emergency.