
Most VPS benchmarks you see online are wrong.
They run for thirty seconds. They use the wrong tools. They report a single number and call it a result. They cannot tell you whether the VPS you are paying for is delivering what the provider promised.
This guide does it the right way.
You will learn the same benchmarking methodology that Site Reliability Engineers use to evaluate production infrastructure. Every tool is explained. Every command is shown. Every output is interpreted. By the end, you will be able to benchmark any VPS thoroughly enough to either confirm it meets your needs or prove it does not.
Whether you are buying a new VPS, evaluating a provider, or troubleshooting a performance problem, the techniques here will give you concrete data instead of guesses.
If you have not set up a VPS before, start with the VPS setup tutorial first. This guide assumes you have SSH access to a working Linux VPS.
Key Takeaways
- Single-shot benchmarks are unreliable. Real benchmarks run for minutes and capture variance, not just averages
- The four core areas to benchmark are CPU, memory, disk I/O, and network. Each needs different tools
fiois the only disk benchmark tool that gives accurate results.ddmeasurements are misleading- For web server load testing,
wrkis significantly better thanabfor modern workloads - Percentile latency (p95, p99) matters far more than averages
- Always benchmark from multiple network locations, not just one
- VPS performance can vary significantly between time of day and day of week. A real benchmark accounts for this
The SRE Methodology in One Page
Before any commands, understand the approach.
A real benchmark is a controlled experiment. It has a hypothesis. It has a methodology. It has reproducible steps. It has statistical analysis.
The methodology in four parts:
| Phase | What You Do |
|---|---|
| Plan | Define what you are measuring and why |
| Baseline | Record current state before any change |
| Measure | Run tests long enough to capture real variance |
| Analyse | Look at distributions, not just averages |
Single-shot tests are the most common mistake. Running ab once for 30 seconds and publishing the result tells you very little. A real benchmark runs each test multiple times over hours or days, captures the full distribution of results, and identifies what is consistent versus what is variable.
The goal is not the highest number. The goal is reliable data you can compare and trust.
Setting Up Your Benchmark Environment
Install everything you will need in one block. These tools are all standard on Linux and free to use.
sudo apt update
sudo apt install -y sysbench fio iperf3 mtr-tiny wrk apache2-utils \
                    htop iotop sysstat ioping dstat speedtest-cli curl
Brief overview of what each tool does:
sysbench: CPU, memory, and database benchmarksfio: The professional disk I/O testing tooliperf3: Network bandwidth measurementmtr-tiny: Network route quality analysiswrk: Modern HTTP load testingapache2-utils: Providesabfor simple HTTP testshtop: Live process monitoringiotop: Live disk I/O monitoringsysstat: Historical performance data collection (sar)ioping: Disk latency testingdstat: Real-time system statisticsspeedtest-cli: Simple network speed testcurl: HTTP requests with timing data
If any tool is unavailable on your distribution, you can usually compile it from source. Both wrk and fio have packages on every major distribution.
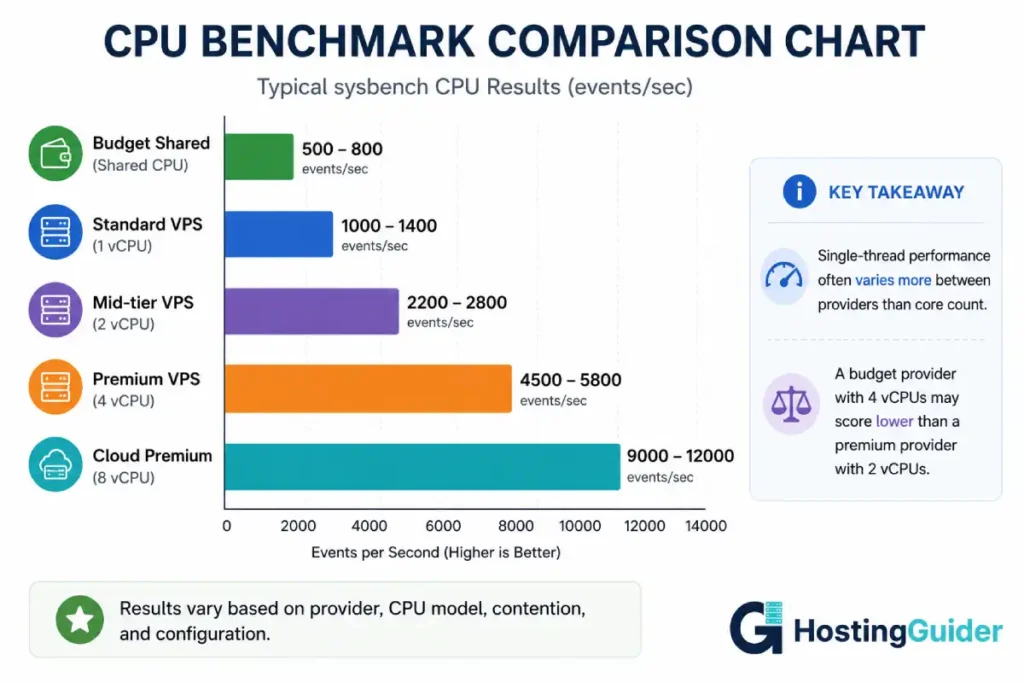
CPU Benchmarks: Measuring Processing Power
CPU benchmarks tell you how fast your VPS can execute computations. For a web server, this affects PHP execution speed, database query processing, and any application-level computation.
sysbench CPU Test
The sysbench tool calculates prime numbers as a controlled CPU workload. It is single-threaded by default but can be parallelised to test multiple cores.
Run a basic CPU benchmark for 30 seconds:
sysbench cpu --threads=1 --time=30 run
The relevant output line:
events per second: 1247.23
A higher number is faster. Save this baseline number for comparison.
Now test all cores. Find how many cores your VPS has:
nproc
Run the test using all cores:
sysbench cpu --threads=$(nproc) --time=30 run
The events per second should scale roughly with the number of cores. If you have 4 cores and the all-cores result is significantly less than 4x the single-core result, your VPS has CPU contention with neighbouring tenants.
Running the Test Multiple Times
A single run can be misleading. Run the test 10 times and average the results:
for i in {1..10}; do
  sysbench cpu --threads=$(nproc) --time=30 run | grep "events per second"
done
Save all 10 numbers. Calculate the average, median, and standard deviation.
If the standard deviation is more than 10% of the average, your VPS has inconsistent CPU performance. This usually indicates shared infrastructure under heavy load from other tenants.
OpenSSL Speed Test
Another reliable CPU benchmark uses the OpenSSL library, which measures cryptographic operations per second. This reflects real-world performance for HTTPS traffic.
openssl speed -evp aes-256-cbc
The output shows bytes processed per second at different block sizes. The 8192-byte column is most representative of HTTPS workloads.
Higher numbers mean faster TLS encryption. For a busy HTTPS site, this directly affects how many simultaneous SSL handshakes the server can perform.
CPU Steal Time
On a VPS, you share physical CPU with other tenants. Sometimes the hypervisor schedules your CPU time and gives the actual CPU to a neighbouring VPS. This is called CPU steal.
Check steal time over 60 seconds:
vmstat 5 12
The st column shows steal percentage. Anything consistently above 5% means you are not getting the full CPU you paid for.
A well-behaved VPS shows steal under 1%. Heavy steal indicates the provider is overselling the underlying hardware.
Memory Benchmarks: Measuring RAM Speed
Memory benchmarks measure how quickly your VPS can read and write to RAM. This affects database performance, application response time, and overall system throughput.
sysbench Memory Test
Test sequential write speed:
sysbench memory --memory-block-size=1K --memory-total-size=100G --memory-oper=write run
The output shows MiB/sec transferred. Modern DDR4 memory typically delivers 8000-15000 MiB/sec for sequential writes on a VPS.
Test random read speed:
sysbench memory --memory-block-size=1K --memory-total-size=100G --memory-oper=read run
Random reads are slower than sequential. Expect 5000-12000 MiB/sec on a typical VPS.
Memory Latency Test
Memory speed and memory latency are different metrics. Speed is bandwidth. Latency is how long a single access takes.
For most workloads, latency matters more than bandwidth. A database doing many small reads cares about latency. Image processing doing large sequential operations cares about bandwidth.
Test memory latency with the mbw tool (install separately if needed):
sudo apt install mbw -y
mbw -t 0 -n 10 256
This runs 10 iterations of memory copying with a 256MB working set. Output shows MiB/sec for three different copy methods. The MEMCPY method represents real-world memory operations.
Memory Pressure Test
A benchmark with no contention is unrealistic. Real servers run multiple processes that compete for memory.
Test memory under pressure:
sysbench memory --memory-block-size=4K --memory-total-size=200G --memory-oper=write --threads=4 run
The 4 threads compete for memory bandwidth. The result is closer to what a real busy server actually experiences.
| Memory Test | Typical Good Result | Red Flag |
|---|---|---|
| sysbench write sequential | 8000+ MiB/sec | Under 4000 |
| sysbench read sequential | 6000+ MiB/sec | Under 3000 |
| mbw MEMCPY | 3000+ MiB/sec | Under 1500 |
| 4-thread contention | At least 60% of single-thread | Under 40% |
Disk I/O Benchmarks: The Hardest to Get Right
Disk benchmarks are where most VPS tutorials produce misleading results. The standard dd command does not measure what you think it measures.
The professional tool is fio (Flexible I/O Tester). It allows you to simulate any I/O pattern accurately.
Why dd Is Wrong for Benchmarking
The classic command:
dd if=/dev/zero of=test.img bs=1M count=1024 conv=fdatasync
This writes 1GB of zeros and measures throughput. The result tells you something, but not what you think.
Problems with dd benchmarks:
- Tests only sequential write performance
- Ignores read performance entirely
- Caches affect results dramatically
- Block size affects results dramatically
- Single-threaded only
- No randomness in the access pattern
Real disk usage is random reads and writes from multiple processes simultaneously. dd measures none of this.
The Right Way: fio Benchmarks
fio accurately simulates real-world workloads. Each test below has a specific purpose.
Random Read IOPS
This measures small random reads, which is the most important metric for databases and busy web servers.
fio --name=randread \
    --ioengine=libaio \
    --rw=randread \
    --bs=4k \
    --direct=1 \
    --size=1G \
    --numjobs=4 \
    --runtime=60 \
    --group_reporting
The relevant output line:
read: IOPS=42137, BW=164.6MiB/s (172.6MB/s) (9879MiB/60008msec)
The IOPS number is what matters. Higher is better.
| Storage Type | Random Read IOPS | What It Means |
|---|---|---|
| Spinning disk | 80-200 | Very slow. Avoid for web servers |
| Basic SSD | 5,000-15,000 | Acceptable for simple sites |
| Good SSD | 15,000-40,000 | Solid performance for most workloads |
| NVMe SSD | 40,000-100,000 | Excellent. Required for database-heavy workloads |
| Premium NVMe | 100,000+ | Top-tier performance |
Random Write IOPS
Random writes test how fast the disk can update small blocks. This affects database write performance and log file writing.
fio --name=randwrite \
    --ioengine=libaio \
    --rw=randwrite \
    --bs=4k \
    --direct=1 \
    --size=1G \
    --numjobs=4 \
    --runtime=60 \
    --group_reporting
Compare the IOPS number against the random read result. Writes are usually 30% to 70% of read IOPS on most storage.
Mixed Read/Write Workload
Real applications do both reads and writes simultaneously. Test a mixed workload that matches a typical web application: 70% reads, 30% writes.
fio --name=mixed \
    --ioengine=libaio \
    --rw=randrw \
    --rwmixread=70 \
    --bs=4k \
    --direct=1 \
    --size=1G \
    --numjobs=4 \
    --runtime=60 \
    --group_reporting
This produces separate read and write IOPS numbers. Both should be reasonably high. Bad VPS storage shows acceptable read numbers but write IOPS that collapses under mixed load.
Sequential Throughput
This tests how fast the disk can read or write large sequential blocks. Affects file uploads, downloads, backups, and image processing.
fio --name=seqread \
    --ioengine=libaio \
    --rw=read \
    --bs=1M \
    --direct=1 \
    --size=4G \
    --numjobs=1 \
    --runtime=30 \
    --group_reporting
Look at the BW (bandwidth) line in the output:
read: IOPS=512, BW=512MiB/s
| Storage Type | Sequential Read | Sequential Write |
|---|---|---|
| Spinning disk | 80-200 MB/s | 60-150 MB/s |
| Basic SSD | 300-500 MB/s | 200-400 MB/s |
| Good SSD | 500-800 MB/s | 400-600 MB/s |
| NVMe SSD | 1500-3500 MB/s | 1000-2500 MB/s |
| Premium NVMe | 3500+ MB/s | 2500+ MB/s |
Disk Latency Test
IOPS measures throughput. Latency measures the time for a single I/O operation. Both matter.
ioping -c 30 -i 0.5 /
This sends 30 small I/O requests to the root filesystem with a half-second delay between each.
The output shows minimum, average, and maximum latency. Look at the maximum value. If it spikes above 10ms occasionally, your VPS has noisy neighbours. If it stays consistently below 1ms, you have excellent low-latency storage.
What to Compare in fio Results
After running all five tests, you have these numbers:
- Random read IOPS
- Random write IOPS
- Mixed workload read IOPS
- Mixed workload write IOPS
- Sequential read bandwidth
- Sequential write bandwidth
- I/O latency (min, avg, max)
A real benchmark report includes all of these, not just one number. A VPS with 100,000 random read IOPS but 200ms maximum latency is not as good as one with 50,000 IOPS and consistent 0.5ms latency.
Network Benchmarks: Bandwidth and Quality
Network performance affects everything users experience. Slow network means slow page loads, regardless of CPU or disk performance.
iperf3 for Bandwidth Testing
iperf3 is the standard tool for measuring network bandwidth between two endpoints. To use it, you need a public iperf3 server to test against, or set one up on a second machine.
Find a public iperf3 server. Many providers run them:
iperf3 -c iperf.he.net -p 5201 -t 30
This runs a 30-second test against the Hurricane Electric public server. The output shows:
[ ID] Interval           Transfer     Bitrate
[  5]   0.00-30.00  sec  3.45 GBytes   988 Mbits/sec
This means 988 Mbps download bandwidth from that endpoint.
Test upload bandwidth:
iperf3 -c iperf.he.net -p 5201 -t 30 -R
The -R flag reverses the direction so the test measures upload instead of download.
| Bandwidth Result | Quality |
|---|---|
| Under 100 Mbps | Concerning. Most providers offer better |
| 100-500 Mbps | Acceptable for typical web sites |
| 500-1000 Mbps | Good. Most premium VPS hits this range |
| 1000+ Mbps | Excellent. Required for high-bandwidth workloads |
Test from multiple iperf3 endpoints to get a complete picture. Bandwidth from your VPS to one location can be very different from bandwidth to another.
Speedtest CLI
For a quick sanity check, use the Ookla Speedtest CLI:
speedtest-cli
This tests download speed, upload speed, and ping latency against the nearest Ookla server.
Speedtest is less precise than iperf3 but easier. Use it for a quick check, not a primary benchmark.
mtr for Route Quality
Bandwidth is one dimension of network performance. Route quality is another. A high-bandwidth connection with packet loss feels worse than a lower-bandwidth connection with clean routes.
mtr combines ping and traceroute to show every hop between your VPS and a destination, plus the packet loss and latency at each hop.
mtr -r -c 100 google.com
This runs 100 pings to Google and reports the results. The columns to focus on:
Loss%: Should be 0% on every hop. Any loss indicates a problemAvg: Average latency at each hop. Should increase gradually toward the destinationBest: Best observed latencyWrst: Worst observed latencyStDev: Standard deviation of latency
A red flag is consistent loss at a specific hop. That hop is your bottleneck.
Run mtr to multiple destinations representing your audience:
mtr -r -c 100 8.8.8.8
mtr -r -c 100 1.1.1.1
mtr -r -c 100 amazon.com
mtr -r -c 100 baidu.com
mtr -r -c 100 yandex.com
If any destination shows packet loss above 1% or latency above 300ms with significant variance, that audience experiences slow service.
Network Latency Test
Simple latency to a known endpoint:
ping -c 100 1.1.1.1
100 pings give a meaningful sample. Look at the summary line:
rtt min/avg/max/mdev = 12.123/15.456/45.789/3.210 ms
The mdev value is the deviation. Low deviation means consistent latency. High deviation means network conditions are unstable.
Web Server Load Testing: wrk Versus ab
This is where most VPS benchmarks fail completely. The wrong tool produces meaningless results.
ab (Apache Bench) is everywhere because it has been available for decades. It is single-threaded, lacks scripting support, and cannot accurately measure modern HTTPS connections with TLS 1.3. It is fine for basic checks but inadequate for serious benchmarking.
wrk is the modern alternative. Multi-threaded, supports scripting, accurately measures sub-millisecond response times, and built for HTTPS.
Basic wrk Test
A 30-second test with 4 threads and 100 concurrent connections:
wrk -t4 -c100 -d30s https://yourdomain.com/
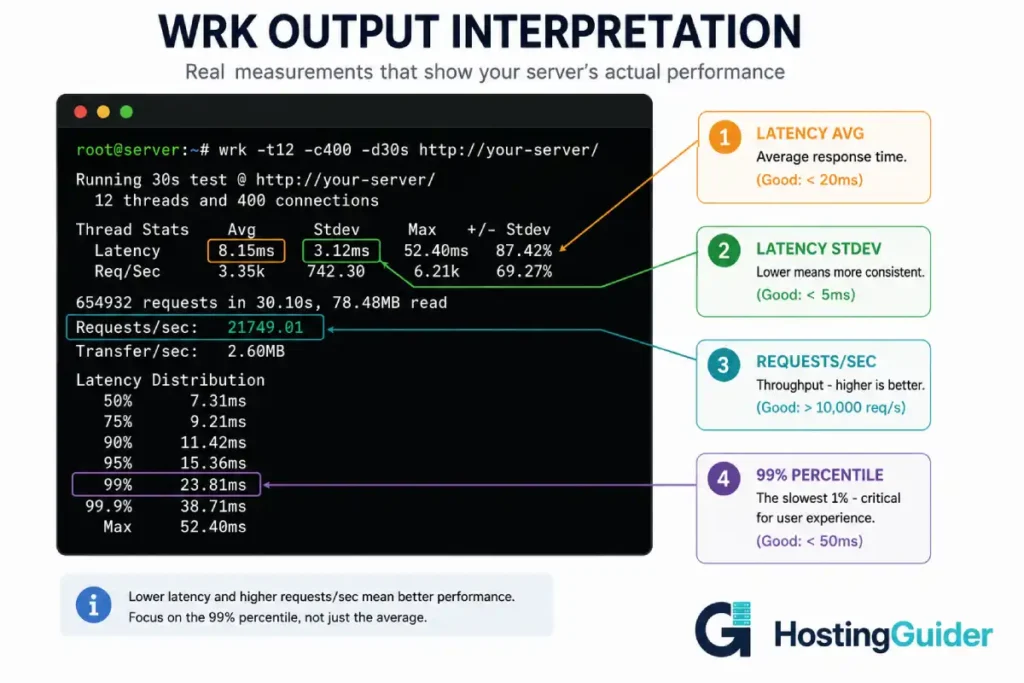
Output:
Running 30s test @ https://yourdomain.com/
  4 threads and 100 connections
  Thread Stats   Avg      Stdev     Max   +/- Stdev
    Latency   125.43ms   45.67ms   1.23s    87.45%
    Req/Sec     201.34     32.12   289.00    78.23%
  24025 requests in 30.00s, 235.45MB read
Requests/sec:    800.83
Transfer/sec:      7.85MB
Key numbers to focus on:
Requests/sec: Throughput under sustained loadLatency Avg: Average response timeLatency Max: Worst-case response timeLatency Stdev: How variable latency is
A stable server shows low standard deviation. An overloaded server shows high standard deviation and a much higher Max latency.
Realistic Concurrency Test
Real traffic is rarely 100 simultaneous identical requests. A more realistic test uses lower concurrency for longer:
wrk -t4 -c50 -d5m https://yourdomain.com/
5 minutes is enough to expose problems that 30-second tests hide. Cache warming, memory leaks, and resource exhaustion all show up in longer runs.
Multiple Endpoint Test
Real users hit different URLs. Test multiple endpoints by using a wrk script:
Create the script:
nano endpoints.lua
Paste:
local paths = {
  "/",
  "/blog/",
  "/contact/",
  "/about/",
  "/wp-login.php"
}

function request()
  local path = paths[math.random(1, #paths)]
  return wrk.format(nil, path)
end
Save with Ctrl+X, then Y, then Enter.
Run wrk with the script:
wrk -t4 -c50 -d2m -s endpoints.lua https://yourdomain.com
This randomly hits different paths, producing a more realistic load profile.
Comparing wrk Results Across Hosts
If you are evaluating multiple hosts, run the same wrk test against identical sites on each host. Use the same content, theme, and plugins. Run the test from the same geographic location at the same time of day.
The most informative comparison is the p99 latency. This is the response time that 99% of requests come in under. A host with a low p99 latency provides a consistent experience even under load.
To get latency distribution from wrk:
wrk -t4 -c50 -d2m --latency https://yourdomain.com/
The --latency flag adds a percentile distribution to the output:
Latency Distribution
  50%   78.23ms
  75%  124.45ms
  90%  198.67ms
  99%  445.23ms
The p99 of 445ms means 1% of requests take longer than 445ms. For a high-traffic site, 1% of millions of requests is a lot of slow page loads.
Stress Test to Find the Breaking Point
The above tests measure performance at known concurrency. A stress test finds the maximum concurrency before failure.
Start at low concurrency and increase until errors appear:
for c in 50 100 200 500 1000 2000; do
  echo "=== Testing with $c connections ==="
  wrk -t8 -c$c -d30s --latency https://yourdomain.com/
  sleep 30
done
This runs six tests with increasing connection counts. Save the output. The level at which error rates increase or latency degrades sharply is your effective capacity.
Continuous Monitoring: The Real Performance Picture
A single benchmark is a snapshot. Long-running performance data is a movie.
Setting Up sar for Historical Data
sar collects performance metrics every few minutes and stores them. After running for a week, you have detailed historical data about CPU, memory, disk, and network performance.
Enable data collection:
sudo sed -i 's/ENABLED=.false./ENABLED=.true./' /etc/default/sysstat
sudo systemctl enable sysstat
sudo systemctl start sysstat
After 24 hours, check what was collected:
sar -u
sar -r
sar -b
sar -n DEV
sar -q
These flags show CPU utilisation, memory, I/O, network throughput, and run queue length respectively.
What to Look For in Long-Term Data
Run the system for a week, then analyse the data.
CPU utilisation patterns. Healthy systems show clear daily and weekly patterns. CPU rises during business hours and drops at night. Unhealthy systems show random spikes that do not correlate with user activity.
Memory trends. Memory usage should stabilise at a predictable level. Memory that keeps growing over time indicates a leak in the application.
I/O patterns. Heavy continuous I/O at unexpected times often indicates a misconfigured backup script or runaway log writing.
Network throughput. Sudden bandwidth spikes can indicate a DDoS attempt, a misconfigured cron job, or a viral content event.
Monitoring Tool Setup
For continuous monitoring beyond sar, set up either Netdata (free, easy) or Prometheus + Grafana (more powerful, more setup).
Install Netdata in one command:
bash <(curl -SsL https://my-netdata.io/kickstart.sh) --dont-wait
After install, Netdata is accessible on port 19999. It shows real-time graphs of every system metric, updating every second. For ongoing performance monitoring, this is unbeatable.
For production environments where alerting matters, UptimeRobot and Site24x7 provide external monitoring that detects what internal tools miss.
Comparing VPS Providers Honestly
Now you have the tools. Here is the methodology for honestly comparing two or more VPS providers.
Step 1: Provision Identical VPS Plans
Sign up for the equivalent plan on each provider. Match these specs as closely as possible:
- Number of vCPUs
- RAM amount
- Storage type and size
- Data centre location closest to your audience
Step 2: Install Identical Base Software
Use the same Linux distribution and version on every test VPS. Install the same packages. Run the same updates.
A clean Ubuntu 22.04 LTS with the standard apt update && apt upgrade -y is a fair starting point for all providers.
Step 3: Run the Full Benchmark Suite
Run every test from this guide on every VPS:
- sysbench CPU (single thread + all threads)
- sysbench memory
- fio random read, random write, mixed, sequential
- iperf3 to multiple endpoints
- mtr to multiple destinations
- wrk against an identical test site
Save all output to files named by provider and timestamp.
Step 4: Run Tests at Multiple Times
VPS performance varies by time. Run the full suite at:
- 02:00 in the local data centre timezone (quietest)
- 09:00 (business start)
- 14:00 (afternoon peak)
- 22:00 (evening peak)
Repeat over three days minimum. Different providers experience different load patterns. A provider that benchmarks well at 2am may struggle at 8pm.
Step 5: Compare Distributions, Not Single Numbers
For each metric on each provider, calculate:
- Mean (average)
- Median (50th percentile)
- 95th percentile
- 99th percentile
- Standard deviation
The provider with the lowest variance often provides better real-world experience than the provider with the highest peak performance but high variance.
Step 6: Calculate Cost Per Performance Unit
Performance per dollar is the honest metric. A VPS that costs twice as much and performs twice as well is equivalent. A VPS that costs twice as much and performs 50% better is worse value.
Calculate for each provider:
- IOPS per dollar
- Requests per second per dollar
- Bandwidth per dollar
For ongoing comparison, providers like Kinsta deliver excellent benchmark numbers at premium price points. Cloudways allows comparing the same managed layer across different underlying cloud providers. Budget providers like Contabo often produce surprising performance per dollar even if absolute numbers are lower than premium hosts.
Common Benchmarking Mistakes
Even with the right tools, you can produce meaningless results. Avoid these errors.
Testing for too short a duration. A 10-second test catches a noisy moment. Run for at least 60 seconds, ideally several minutes.
Running tests once and trusting the result. Always run each test at least 5 times. Use the median.
Benchmarking immediately after server creation. Fresh VPS instances often show artificially good performance for the first few hours before settling into normal patterns. Wait 24 hours.
Testing with caches warm. Hosts use aggressive caching. The second request to a URL hits the cache and is much faster than the first. Force cache bypass with query parameters when testing real server performance.
Comparing across different data centres. A test from London to a London VPS is incomparable to a test from London to a Singapore VPS. Hold geographic location constant.
Ignoring time of day. A VPS that performs well at 3am may struggle at 9pm. Test at multiple times.
Trusting single-number results. A benchmark that reports only average response time is hiding the picture. Demand percentile distributions.
Forgetting to monitor while testing. Run htop and iotop in another terminal during benchmarks. They show what the system is actually doing while the benchmark runs.
The problem of misleading benchmarks extends far beyond your own tests. Most published hosting benchmarks suffer from these same mistakes, which is why benchmarking yourself becomes essential when the decision matters.
Pre-Purchase Benchmark Checklist
Before committing to any VPS provider for production, run this checklist:
| Check | Tool | Pass Criteria |
|---|---|---|
| Single-thread CPU | sysbench cpu –threads=1 | 1000+ events/sec |
| All-threads CPU | sysbench cpu –threads=$(nproc) | Scales linearly with cores |
| CPU steal time | vmstat 5 12 | Under 2% sustained |
| Memory bandwidth | sysbench memory | 6000+ MiB/sec |
| Random read IOPS | fio randread | 10,000+ for general use |
| Random write IOPS | fio randwrite | 5,000+ for general use |
| Disk latency | ioping | Max under 5ms typical |
| Network bandwidth | iperf3 | At minimum 500 Mbps |
| Network latency | mtr | Under 1% loss, predictable RTT |
| HTTP performance | wrk | p99 under 500ms at expected load |
| 24-hour stability | repeated tests | Variance under 15% |
A VPS that fails three or more of these checks is not suitable for production traffic. A VPS that passes all of them is a solid foundation.
For deeper context on why these numbers vary across providers, the architecture behind VPS hosting explains the resource allocation models that drive the differences.
Tuning Before You Conclude
Before declaring a VPS underpowered based on benchmarks, verify it has been properly tuned. Default kernel settings on most VPS images are not optimised for web traffic.
A well-tuned VPS can outperform a poorly-tuned VPS with twice the resources. The eight kernel parameters that actually improve web performance directly affect every benchmark number this guide produces.
Run your benchmark suite twice: once with default settings, once after applying tuning. The difference is often dramatic. A VPS that looked mediocre at defaults may be excellent after proper tuning.
Frequently Asked Questions
How long should I run benchmarks for accurate results?
Each individual test should run for at least 60 seconds, ideally several minutes. For disk I/O specifically, 5 minutes minimum because storage can show false high performance for the first few seconds while caches are warm. For network tests, 30 seconds is the minimum. For HTTP load tests, run for at least 2 minutes to give the server time to reach steady state. For overall comparison between providers, repeat each test set across multiple days and multiple times of day.
Why is dd not a good disk benchmark?
dd measures sequential write throughput only. It does not test random I/O, which is what databases and web servers actually do. It does not test reads. It does not run multiple parallel I/O streams. It is affected by filesystem caching in ways that produce misleading high numbers. fio correctly models real-world I/O patterns and produces results that actually predict application performance. Always use fio for serious disk benchmarking.
Should I disable swap during benchmarks?
For pure CPU and memory benchmarks, yes. Swap activity during a CPU benchmark distorts results. Disable swap temporarily with sudo swapoff -a before benchmarks, then re-enable with sudo swapon -a after. For real-world workload benchmarks like web server load tests, leave swap enabled because it reflects production behaviour. If your server uses heavy swap during a load test, that is useful diagnostic information that swap is being relied on under load.
What is the most important single benchmark for a web server?
For modern web servers, random read IOPS measured with fio is the single most predictive benchmark. Database queries, PHP autoloading, and serving static files all depend heavily on random read performance. A VPS with 50,000 random read IOPS will outperform one with 10,000 IOPS for almost every web workload, regardless of CPU or RAM differences. If you can only run one benchmark, run fio --rw=randread --bs=4k.
How do I benchmark if my VPS provider does not allow installing tools?
This typically means you are on managed hosting rather than unmanaged VPS. Managed providers handle benchmarking themselves and tune the underlying infrastructure for the workloads they support. You can still benchmark from outside using HTTP load testing tools like wrk from a separate machine, and uptime monitoring services that measure response times. For internal benchmarks, you need an unmanaged VPS or dedicated server where you have root access.
What network latency is acceptable for a web server?
Latency from your VPS to your audience location should be under 100ms for a good user experience. Under 50ms feels instant. Above 200ms feels noticeably sluggish, especially for interactive elements. The same VPS can have excellent latency for users near the data centre and poor latency for users in distant regions. This is why CDNs exist. For audiences scattered globally, use a CDN to serve static content from edge locations, while the VPS handles dynamic requests for users in its region.
How often should I re-run benchmarks on a production VPS?
Once a quarter is reasonable for spot-checks. Run the full benchmark suite weekly during the first month after launching a new VPS to establish a stable baseline. After that, automated monitoring catches gradual degradation while occasional benchmarks confirm the underlying hardware still performs as expected. Re-benchmark immediately if you notice unexpected slowness, after any provider-side maintenance, or after migrating to a new server.