
The global web hosting market was worth between $149 billion and $180 billion in 2025, depending on the research methodology.
Every website on the internet needs hosting infrastructure to stay online, and that demand is growing fast, driven by cloud adoption, AI workloads, and ongoing small business digitization.
Whether you are choosing a web hosting provider, researching the industry, or planning a hosting-related business, the data behind this market tells a clear story.
This page covers the most current and verified web hosting statistics available, organized by market size, hosting type, cloud infrastructure, pricing trends, and uptime benchmarks.
Every statistic is sourced from a primary research firm, official industry research, and HostingGuider’s own provider testing.
Quick Stats: Key Web Hosting Numbers for 2026
- Global web hosting market size: $149B–$180B (2025, range across research firms)
- Fortune Business Insights projection by 2034: $661 billion
- Mordor Intelligence projection by 2031: $300 billion
- Grand View Research projection by 2030: $320 billion
- North America’s share of the global market: 38.6–41% (Mordor / Fortune)
- VPS hosting market size: $5.2B–$5.7B (2025, IMARC / Mordor)
- Dedicated hosting market target: $29.6 billion by 2026
- Cloud infrastructure spend: $129 billion in Q1 2026 alone
- Gartner public cloud end-user spending: $723.4 billion in 2025
- Average enterprise downtime cost: $300,000+ per hour (ITIC 2024)
Table of Contents
Key Takeaways
The web hosting market is large, growing, and segmenting rapidly. Estimates across research firms range from $149 billion to $180 billion in 2025, not because one is wrong, but because each firm defines the market differently. The trend is consistent across all of them: strong growth driven by cloud, AI, and ecommerce.
Cloud is the fastest-growing hosting segment. Cloud infrastructure spending grew 35% year-over-year in Q1 2026, reaching $129 billion for a single quarter, a rate of growth last seen when the market was less than half its current size.
Downtime costs have risen significantly. The average enterprise now loses more than $300,000 per hour during an outage, according to ITIC’s data. A 99.9% uptime SLA that allows 8.76 hours of downtime per year is not a minor contractual detail for a business-critical website.
Renewal pricing is the hidden cost most website owners underestimate. The gap between introductory and renewal rates at most major hosting providers is significant, and understanding it before you sign matters more than comparing promotional prices between providers.
Web Hosting Market Size and Growth
How Researchers Measure the Market
The web hosting market does not have a single universally agreed definition. Some research firms include broad cloud infrastructure and data center services; others focus on traditional hosting plans for websites and applications. This is why estimates vary, not because the data is wrong, but because the scope differs.
The three most-cited primary market research reports for 2025–2026 show the following:
| Research Firm | 2025 Market Size | Projected Peak | CAGR |
| Fortune Business Insights | $149.30 billion | $661B by 2034 | ~17.8% |
| Mordor Intelligence | $180.35 billion | $300B by 2031 | 10.49% |
| Grand View Research | (2022 baseline: $77.78B) | $320B by 2030 | 20.2% |
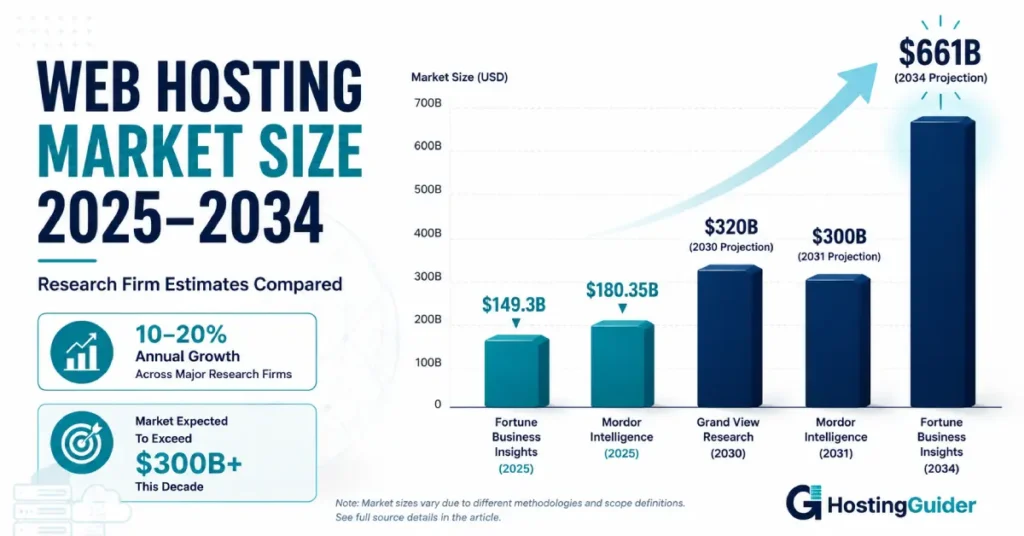
The most reliable way to read these figures is as a range. The consensus across all three: the hosting market is growing at 10–20% per year and was comfortably in the $150–$180 billion range as of 2025.
United States Market
The U.S. is the largest single national hosting market globally. Fortune Business Insights values it at $149.30 billion in 2025, projected to reach $133.46 billion by 2032 at a 23.5% CAGR, according to their web hosting market report.
North America accounts for 38.6–41% of the global hosting market, depending on the research firm. Mordor Intelligence places North America at 38.63% in 2025, while Fortune Business Insights reports 41%. Both agree it is the dominant region. Asia-Pacific is the fastest-growing region, with Mordor Intelligence projecting a 10.93% CAGR for the region through 2031.
Author note: “Across the hosting accounts I actively manage for HostingGuider and my other projects, I’ve watched infrastructure costs and service tiers shift noticeably over three years, not just in pricing, but in what providers include at each level. The market isn’t just growing in revenue; it’s growing in complexity.” (Shaddam Hossain, Founder, HostingGuider)
What Is Driving Growth?
Cloud adoption and AI demand: Global end-user spending on public cloud services reached $723.4 billion in 2025, according to Gartner. Cloud infrastructure spending grew 35% year-over-year in Q1 2026 alone, driven significantly by AI training and inference workloads.
Hybrid cloud adoption: Gartner projects that 90% of organizations will adopt a hybrid cloud approach through 2027, as businesses balance performance, cost, and compliance requirements across multiple environments.
SMB digitization: Millions of small and medium-sized businesses have expanded their online presence in recent years, creating sustained demand for shared hosting, entry-level VPS, and website builder platforms.
Shared Hosting
Shared hosting places multiple websites on the same physical server, with resources divided between accounts. It is the most common starting point for new websites because of its low cost and ease of use.
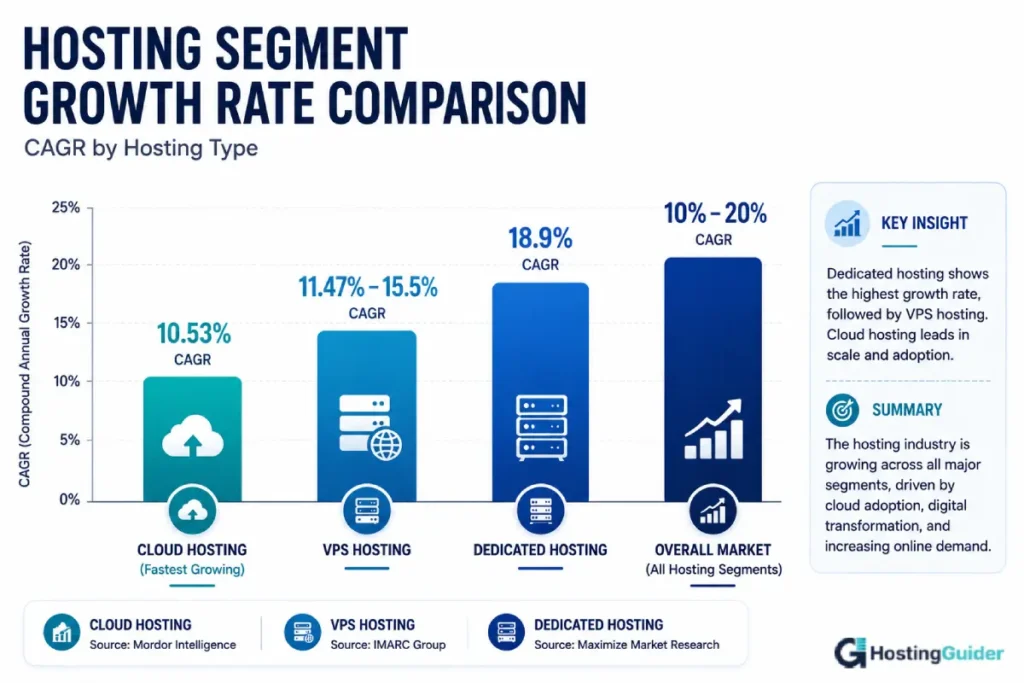
Shared hosting is the largest hosting segment by volume according to market research from Mordor Intelligence. Cloud hosting is growing at the fastest rate, 10.53% CAGR through 2031, and is gradually taking a larger share of the overall market, particularly among businesses moving beyond shared environments.
Who Uses Shared Hosting?
Shared hosting is primarily used by personal websites and blogs, small business websites with low to moderate traffic, portfolio and landing page sites, and new online stores in their early stages.
It is generally not the right choice for high-traffic sites, applications requiring custom server configurations, or sites handling sensitive transactional data at scale.
For guidance on when to upgrade, see our article on signs you have outgrown your hosting plan.
VPS Hosting Statistics
VPS hosting gives each site its own dedicated resources on a shared physical server, more power and flexibility than shared hosting, at a lower cost than a dedicated server.
VPS Market Size
Two primary research firms publish independent VPS market estimates:
| Research Firm | 2025 Market Size | Projection | CAGR |
| IMARC Group | $5.7 billion | $15.6B by 2034 | 11.47% (2026–2034) |
| Mordor Intelligence | $5.2 billion | $10.66B by 2030 | 15.5% (2025–2030) |
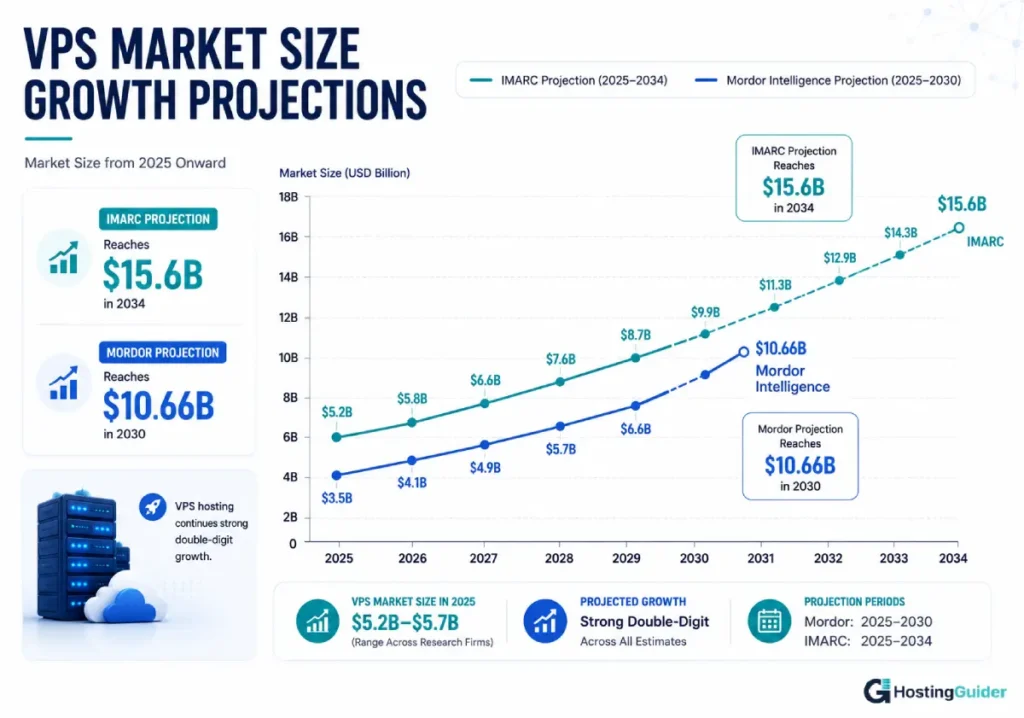
Both firms agree on a market in the $5–6 billion range in 2025, growing at double-digit rates. The difference in long-term projections reflects different forecast horizons and market definitions.
Managed vs. Unmanaged VPS
Within the VPS market, managed services represent the dominant and fastest-growing segment.
Managed VPS providers handle server maintenance, security patching, and configuration on behalf of customers, removing the technical barrier for non-developer users.
According to Mordor Intelligence’s VPS market analysis, the unmanaged VPS segment posts a 16.62% CAGR through 2031, suggesting strong growth in both managed and unmanaged tiers as the overall market expands.
For a full comparison of your options, see our guide on managed vs. unmanaged VPS hosting. For tested recommendations, see our list of the best VPS hosting providers.
Regional VPS Growth
North America leads current VPS revenue. However, IMARC Group projects Asia-Pacific to become the largest VPS revenue region within the coming years, driven by dense population, expanding ecommerce, and rising internet penetration in high-growth markets.
Cloud Hosting Statistics
Cloud hosting distributes website resources across multiple servers, offering scalability and resilience that single-server options cannot match. It is the fastest-growing segment across the hosting market.
Cloud Infrastructure Market Size
Global cloud infrastructure service spending reached $129 billion in Q1 2026, a 35% year-over-year increase, placing the cloud market on track to exceed $500 billion in annual revenue for the first time in 2026, according to Synergy Research Group.
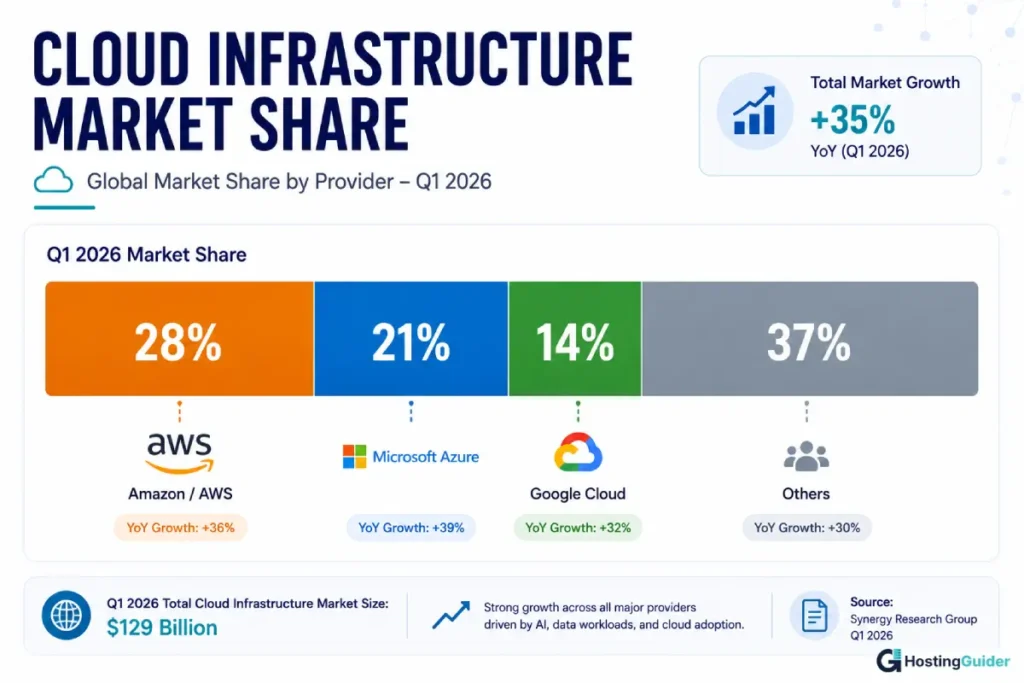
This is the ninth consecutive quarter of accelerating cloud infrastructure growth and the highest year-over-year rate since late 2021, when the market was less than half its current size. The primary driver is AI compute demand.
Separately, Gartner reports total public cloud end-user spending, a broader category that includes SaaS, reached $723.4 billion in 2025, growing 21.5% year-over-year.
Cloud Provider Market Share (Q1 2026)
The three largest cloud providers, Amazon Web Services, Microsoft Azure, and Google Cloud, together account for approximately 67% of the global cloud infrastructure market, according to Synergy Research Group’s Q1 2026 report.
| Provider | Market Share (Q1 2026) | Trend |
| Amazon Web Services (AWS) | 28% | Declining from ~33% in 2021 |
| Microsoft Azure | 21% | Consistently growing |
| Google Cloud | 14% | Growing steadily |
| All Others | 37% | Includes Cloudflare, Vultr, Hetzner, OVH |
AWS’s market share has declined from approximately 33% in late 2021 to 28% in Q1 2026, while Azure has consistently grown faster than AWS in recent quarters.
Hybrid Cloud Adoption
Gartner projects that 90% of organizations will adopt a hybrid cloud approach through 2027, spreading workloads across on-premises infrastructure and one or more cloud providers to balance performance, cost, and data sovereignty requirements.
For website hosting specifically, this trend shows up in managed cloud hosting growth, where providers like Cloudways, Vultr, and DigitalOcean serve a growing share of SMB customers. See our best cloud hosting guide for tested options.
Dedicated Server Statistics
Dedicated servers give a single customer exclusive use of an entire physical server, the highest performance, most control, and strongest isolation of any hosting type.
Dedicated Hosting Market Size
The dedicated server hosting market was valued at $20.15 billion in 2024 and is projected to reach $29.6 billion by 2026, growing at a CAGR of 18.9%, according to Maximize Market Research. By 2032, the market is expected to reach $80.49 billion at the same growth rate.
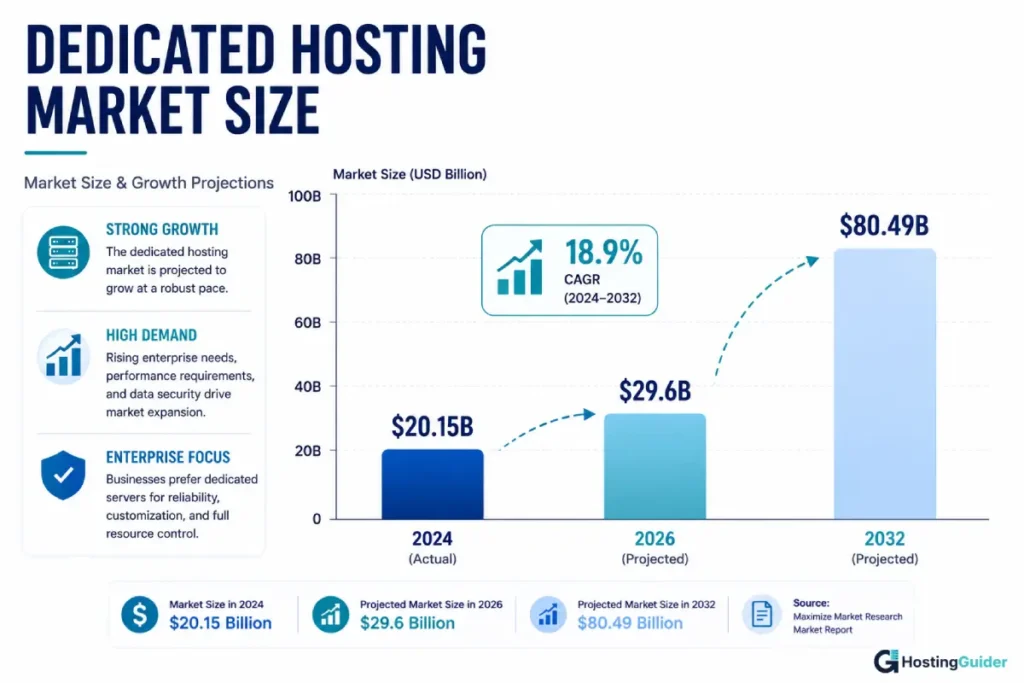
More than 41 million websites currently rely on dedicated servers to meet their performance demands, according to Maximize Market Research.
The 18.9% CAGR is higher than the overall hosting market growth rate, driven by AI inference workloads that require bare-metal servers with high-memory, high-CPU configurations that virtualization cannot always replicate efficiently.
For context on whether dedicated hosting fits your situation, see our guide on when a business needs a dedicated server.
Managed WordPress Hosting Statistics
Managed WordPress hosting is a premium hosting category built specifically for WordPress sites. Providers handle server-level WordPress management: updates, security patches, caching, and performance optimization.
Market Size and Growth
The WordPress hosting market was valued at $8.74 billion in 2025 and is projected to reach $9.32 billion in 2026, according to 360iResearch. The market is expected to reach $13.34 billion by 2032 at a CAGR of 6.21%.
This growth rate is steady rather than explosive, reflecting a maturing market where the managed WordPress category has moved from a niche premium product to a mainstream choice for business websites.
Author note: “When I was optimizing WordPress hosting for themes distributed through Envato ThemeForest, the performance difference between a generic shared plan and a managed WordPress environment was significant, not just in speed numbers, but in the hours I stopped spending on server-level issues. That real-world difference is what drives managed WordPress adoption.” (Shaddam Hossain)
For tested options, see our best managed WordPress hosting guide.
WordPress Context
WordPress powers approximately 41.9% of all websites globally as of May 2026, holding roughly 59.4% CMS market share, according to W3Techs. The scale of WordPress usage creates sustained demand for WordPress-specific hosting at every tier, from basic shared WordPress plans to premium managed environments.
eCommerce Hosting Statistics
eCommerce websites have some of the most demanding hosting requirements: high uptime, fast load times, PCI DSS compliance, and the ability to handle traffic spikes during sales events.
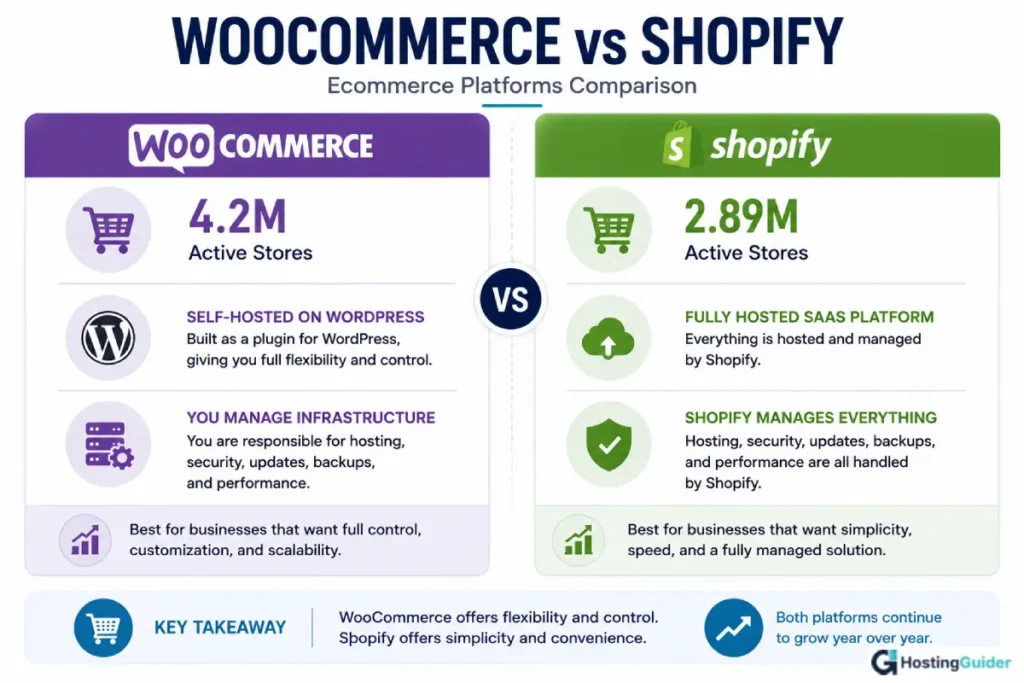
WooCommerce and Shopify Platform Data
The two dominant ecommerce platforms represent very different hosting models:
WooCommerce powers approximately 4.2 million active online stores worldwide, according to StoreLeads data. WooCommerce runs on WordPress, so store owners are responsible for managing their own hosting, making infrastructure decisions more consequential than on hosted platforms.
Shopify powers approximately 2.89 million active stores. (Source) Shopify handles all infrastructure internally, so Shopify users do not choose their own hosting.
For tested WooCommerce hosting options, see our guide to the best WooCommerce hosting providers.
Hosting Requirements for eCommerce
Speed and uptime directly affect ecommerce revenue.
Key benchmarks from web performance research:
- Every 100 milliseconds of added page load time reduces conversions by approximately 1%
- A 1-second delay reduces customer satisfaction by 16%
- PCI DSS compliance, required for processing card payments, demands specific server-level security controls that not all shared hosting environments provide
For a full breakdown of what ecommerce sites need from hosting, see our guide on eCommerce hosting requirements.
Green and Sustainable Hosting Statistics
Data center energy consumption is a growing concern for businesses with environmental commitments.
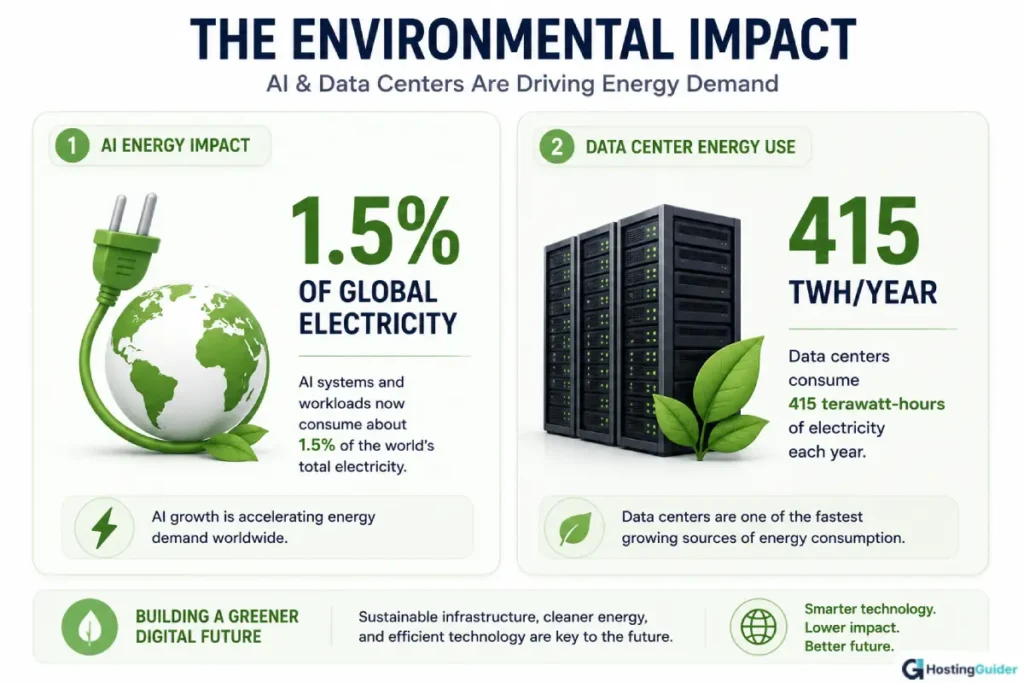
Data Center Energy Use
Data centers account for approximately 1.5% of global electricity consumption, according to the International Energy Agency. Data centers globally consume roughly 415 terawatt-hours (TWh) of electricity per year, comparable in scale to the aviation industry’s total fuel energy use.
The major cloud providers, AWS, Google, and Microsoft, have each made public commitments to renewable energy purchasing, though the timelines and measurement methods vary between them. For website owners with sustainability requirements, see our guide to the best green hosting providers.
Web Hosting Uptime and SLA Statistics
Uptime is one of the most critical factors in any hosting decision, and the cost of getting it wrong has risen significantly.
The Cost of Downtime
The average hourly cost of IT downtime is now $300,000+ per hour for most mid-size and large enterprises, according to ITIC’s Hourly Cost of Downtime Survey. 41% of enterprises report hourly losses of $1 million to $5 million or more.
Gartner’s long-standing baseline, cited by monitoring researchers including Dotcom-Monitor, puts the average IT downtime cost at approximately $5,600 per minute, or roughly $336,000 per hour, across all organization sizes.
By company size, the range breaks down as follows:
| Organization Size | Estimated Downtime Cost |
| Micro SMB (under 25 employees) | ~$1,670/minute ($100K/hour) |
| SMB (20–100 employees) | 57% report over $100K/hour |
| Mid-market enterprise | Typically $200K–$500K/hour |
| Large enterprise | $300K–$1M+/hour baseline |
| Regulated industries (banking, healthcare) | $5M+/hour |
For a deeper look at why uptime matters and how to monitor it, see our guide on website uptime importance.
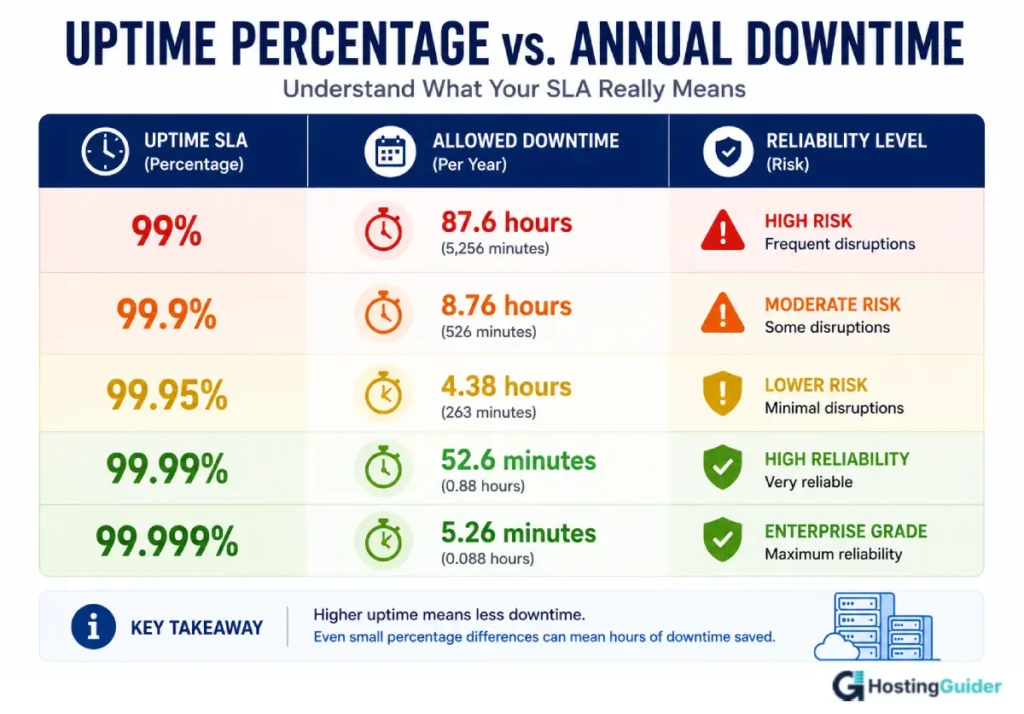
What Uptime SLAs Actually Mean
Most hosting providers advertise 99.9% uptime. In practice, that allows 8.76 hours of downtime per year within the contractual terms. A 99.99% guarantee reduces that to just 52 minutes per year, a meaningful difference for any business-critical website.
Real-world cloud provider uptime from provider status data and third-party monitoring:
| Provider | Reported Average Uptime (2025) |
| Amazon Web Services (AWS) | 99.982% |
| Microsoft Azure | 99.975% |
| Google Cloud | 99.973% |
Note that advertised SLAs and real measured uptime are different things. HostingGuider actively monitors uptime across 20+ providers during review testing. For real-world results, see our best web hosting guide.
Root Causes of Hosting Downtime
According to the Uptime Institute Annual Outage Analysis 2025, the leading causes of impactful outages include:
- IT and networking issues: 23% of impactful outages in 2024, an increasing share year-over-year
- Power failures: Remain the leading cause of the most severe data center outages
- Human error: The proportion caused by failure to follow procedures rose by 10 percentage points in 2025 compared to 2024
- Cybersecurity incidents: On the rise and often carry severe, lasting business impact
The Uptime Institute also notes a positive longer-term trend: for the fourth consecutive year, overall outage frequency and general severity have declined relative to the growth of digital infrastructure.
Web Hosting Pricing Trends
Understanding pricing trends helps you avoid overpaying and spot providers who rely on aggressive introductory discounts before steep renewal price increases.
Author note: “After Reviewing more than 30 hosting providers at HostingGuider has given me a clear view of how pricing actually works in this industry. Introductory rates and renewal rates are often completely different products. I have seen renewal prices jump as much as three times the first-term price at some providers.” (Shaddam Hossain)
Introductory vs. Renewal Pricing
Most providers offer deeply discounted first-term rates, sometimes 60–80% below the standard price, and then renew at the full rate. This is one of the most significant and least-discussed patterns in the consumer hosting market.
For an honest breakdown of how this works, see our articles on web hosting renewal pricing and why cheap hosting becomes expensive later.
Average Hosting Prices by Tier (2026)
The following pricing ranges are based on HostingGuider’s own review and testing data across 30+ actively monitored hosting accounts. This is proprietary data that cannot be replicated by providers or competitor review sites.
| Hosting Type | Typical Intro Price | Typical Renewal Price |
| Shared Hosting | $1.99–$5.99/month | $8–$18/month |
| VPS (Unmanaged) | $4–$20/month | $10–$40/month |
| VPS (Managed) | $20–$100/month | $25–$120/month |
| Managed WordPress | $20–$100/month | $25–$150/month |
| Dedicated Server | $80–$300/month | $100–$500+/month |
| Cloud (Pay-as-you-go) | $5–$50+/month | Variable usage-based |
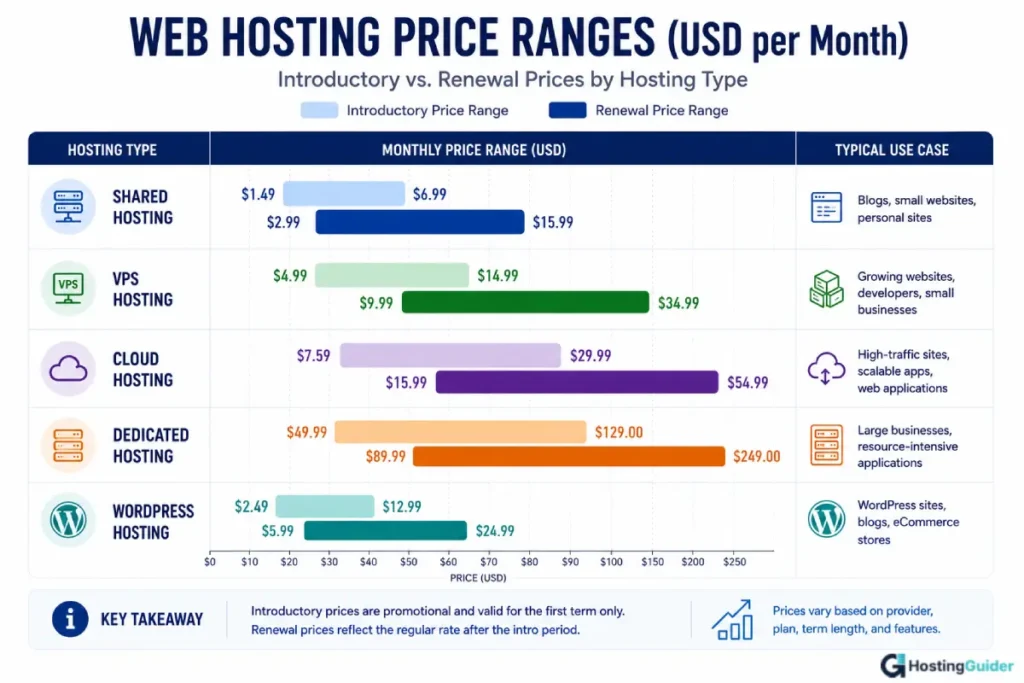
For context on what you actually get at different price points, see our article on the real difference between cheap and premium hosting.
Web Hosting Market Leaders
The web hosting market is highly fragmented; thousands of providers compete globally, but a clear set of dominant companies account for a disproportionate share of total market revenue.
Based on W3Techs technology usage statistics, which track the infrastructure of millions of websites, the providers with the largest global website footprint include:
- GoDaddy: One of the largest by total hosting accounts and domain volume
- Hostinger: Strong growth in the affordable shared and VPS market
- Bluehost: Large WordPress hosting share, owned by Newfold Digital
- SiteGround: Strong position in managed WordPress and cloud hosting
- WP Engine: Market leader in premium managed WordPress
- Kinsta: Fast-growing premium managed WordPress provider
- AWS / Azure / Google Cloud: Dominant in cloud infrastructure and enterprise hosting
For detailed, independently tested reviews of individual providers, see the HostingGuider reviews section.
Frequently Asked Questions
How big is the web hosting market in 2026?
The global web hosting market is valued at approximately $149–$180 billion in 2025, depending on the research firm and market definition. Fortune Business Insights estimates $149.30 billion, while Mordor Intelligence estimates $180.35 billion. The market is projected to reach between $300 billion and $661 billion by 2030–2034, depending on methodology and forecast horizon.
Which hosting segment is growing the fastest?
Cloud hosting is expanding at the fastest rate. Global cloud infrastructure spending grew 35% year-over-year in Q1 2026, reaching $129 billion for a single quarter, according to Synergy Research Group. Dedicated server hosting also shows a strong 18.9% CAGR through 2032, driven by AI infrastructure demand.
How many websites are there in the world in 2026?
There are 392.5 million registered domain names globally as of Q1 2026, according to the Domain Name Industry Brief (DNIB). Not all registered domains host active websites; a significant share are parked, defensive registrations, or inactive. The number of actively visited websites is substantially lower than the total domain registrations.
What does 99.9% uptime actually mean?
A 99.9% uptime guarantee allows up to 8.76 hours of downtime per year within the provider’s service level agreement. A 99.99% guarantee allows only 52 minutes per year. The practical difference matters significantly for business-critical websites where downtime directly costs revenue.
What is the cost of website downtime?
The average IT downtime costs approximately $5,600 per minute, roughly $336,000 per hour, across all organization sizes, according to Gartner’s widely cited baseline. ITIC’s 2024 Hourly Cost of Downtime Survey puts the cost above $300,000 per hour for more than 90% of mid-size and large enterprises.
Which cloud provider has the largest market share in 2026?
Amazon Web Services (AWS) holds 28% of the global cloud infrastructure market share as of Q1 2026, according to Synergy Research Group. Microsoft Azure holds 21% and Google Cloud 14%. Together, the three providers account for 67% of the public cloud infrastructure market.
Why do web hosting price estimates vary so much between research firms?
Different research firms use different definitions of “web hosting.” Some include broad cloud infrastructure and platform services; others focus on traditional shared, VPS, dedicated, and managed hosting plans.
This produces widely varying market size estimates from the same time period, all of which can be accurate within their own defined scope.