
Your VPS is slow, and it matters: pages load late. SSH feels sluggish. Something is wrong, but the dashboard just shows green checkmarks.
Most people respond when their VPS is slow by guessing. Restart the server. Upgrade the plan. Reinstall the software. Sometimes one of these accidentally fixes the problem. Usually it does not, because the real cause was never identified.
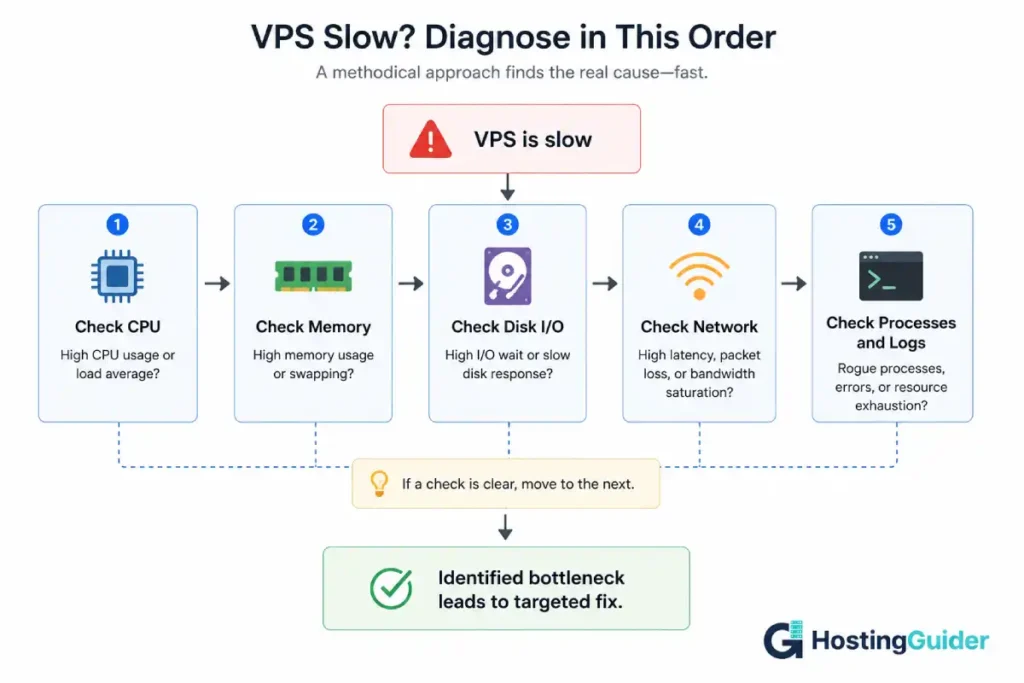
When your VPS is slow, there is always a cause, and that cause is almost always one of five things: CPU, memory, disk I/O, network, or a runaway process. Each of these leaves a specific fingerprint that a handful of commands can reveal in minutes. This systematic guide for when your VPS is slow walks through the diagnosis in order, from fastest checks to deepest checks, so you find the actual cause before you change anything.
By the end of this guide on what to do when your VPS is slow, you will know exactly which resource is the bottleneck on your VPS, which process is causing it, and what to do about it.
Before You Start: Why Your VPS Is Slow Needs a Five-Minute Overview First
Before diving into individual checks, run one command that gives you a snapshot of everything at once. SSH into your VPS and run:
topThis shows CPU usage, memory usage, and the top processes by resource consumption, all on one screen. Look at three numbers immediately:
The load average, shown in the top right, as three numbers like 2.45, 1.88, 1.20. These represent the average system load over the last 1, 5, and 15 minutes. Compare this number to your number of CPU cores. If your VPS has 2 cores and the load average is consistently above 2, the system is overloaded.
The %Cpu(s) line, showing how CPU time is split between user processes, system processes, and idle time. If id (idle) is near 0%, your CPU is the bottleneck.
The memory line, showing total, used, free, and available memory. If available is very low and used is very high, memory is a likely cause.
Press q to exit top.
This one command often points directly at the problem. The rest of this guide goes deeper into each area so you can confirm the cause and find the specific process responsible.
A note before continuing: the quality of your underlying hosting affects how often these problems happen and how severe they are. A VPS with consistently maxed CPU on a budget plan is often a sign the plan itself is undersized for the workload, not just a one-time issue to fix. Our explainer on cloud hosting auto-scaling covers what actually happens when a server needs more resources than the plan provides.
Check 1: Is Your VPS Slow Because of CPU?
CPU exhaustion is one of the most common causes of a slow VPS, and one of the easiest to confirm.
Run top again, but this time sort by CPU usage. Inside top, press Shift + P. This sorts the process list by CPU usage, highest first.
Look at the top few processes. If one process is using 90% to 100% of a CPU core consistently, that process is your bottleneck.
For a more detailed view over time, use vmstat. If it is not installed:
sudo apt install sysstat -y
Then run:
vmstat 2 5
This prints system statistics every 2 seconds, 5 times. Look at the r column (number of processes waiting for CPU) and the id column under CPU (percentage idle). If r is consistently higher than your number of CPU cores, processes are queuing up waiting for CPU time. If id stays near 0, the CPU has no spare capacity.
Check how many CPU cores your VPS actually has:
nproc
A load average of 4 on a 2-core VPS means the system is asking for twice the CPU it has. A load average of 1.5 on a 4-core VPS is not a problem at all. Always read load average relative to your core count, never as an absolute number.
What it looks like when your VPS is slow from CPU exhaustion: Everything on the server feels slow at once. SSH commands take longer to respond. Web pages load slowly across the board, not just one specific page. The server “feels heavy.”
Common causes: An inefficient script or cron job running in a loop. A PHP process stuck in an infinite loop from a plugin bug. A backup or compression task running during peak hours. A cryptocurrency miner installed by an attacker (more common than people expect on compromised servers). Database queries without proper indexes causing the database to scan entire tables repeatedly.
Check 2: Is Your VPS Slow Because of Memory?
Memory problems often masquerade as CPU problems because when a server runs low on memory, it starts swapping, and swapping uses CPU.
Check memory usage:
free -h
The -h flag shows human-readable sizes (MB, GB). Look at the available column for the Mem row. This is the memory genuinely free for new processes, accounting for cache that can be reclaimed. If available is very low relative to total, memory is tight.
Now look at the Swap row. If used swap is anything more than a small amount (a few hundred MB on a server that has been running a while is normal; multiple GB is not), your server is actively swapping memory to disk.
Swapping is the single biggest hidden cause of a slow VPS that “should” have enough resources. Disk is dramatically slower than RAM. When the system swaps, every memory access that hits swapped data becomes a disk operation. A server that is swapping heavily can feel 10 to 50 times slower than the same server with adequate memory, even though the CPU and disk numbers individually might look only moderately stressed.
Check which processes are using the most memory:
ps aux --sort=-%mem | head -10
This lists the top 10 processes by memory usage. Look for anything unexpectedly large: a database process that has grown over time without limits, a PHP-FPM pool with too many workers configured for the available RAM, or an application with a memory leak that grows until the server runs out.
What it looks like when your VPS is slow from memory exhaustion: The server is slow to start with, then suddenly becomes extremely slow or briefly unresponsive, then recovers. SSH sessions can freeze for several seconds. The dmesg log may show the kernel’s Out Of Memory killer terminating processes.
Check for OOM kills:
dmesg | grep -i "out of memory"
If this returns results, the kernel has been forcibly killing processes due to memory exhaustion. This is a serious sign that the server does not have enough RAM for its workload.
Common causes: A database server (MySQL, PostgreSQL) configured with a buffer size larger than available RAM. Too many PHP-FPM or application worker processes for the RAM available. A memory leak in a long-running application that grows until memory runs out. Multiple services competing for memory on a small VPS (web server, database, cache, mail server all on one small instance).
Check 3: Is Your VPS Slow Because of Disk I/O?
Disk I/O problems are less obvious than CPU or memory problems because the disk can look “fine” in terms of free space while being completely saturated in terms of read/write speed.
Check disk space first, because a full disk causes different symptoms (errors, not just slowness):
df -h
Look for any filesystem at or near 100% usage. A disk that is completely full can cause databases to fail writes, logs to stop, and applications to behave unpredictably. This is a different problem from slow I/O, but it is worth ruling out first.
Now check disk I/O activity:
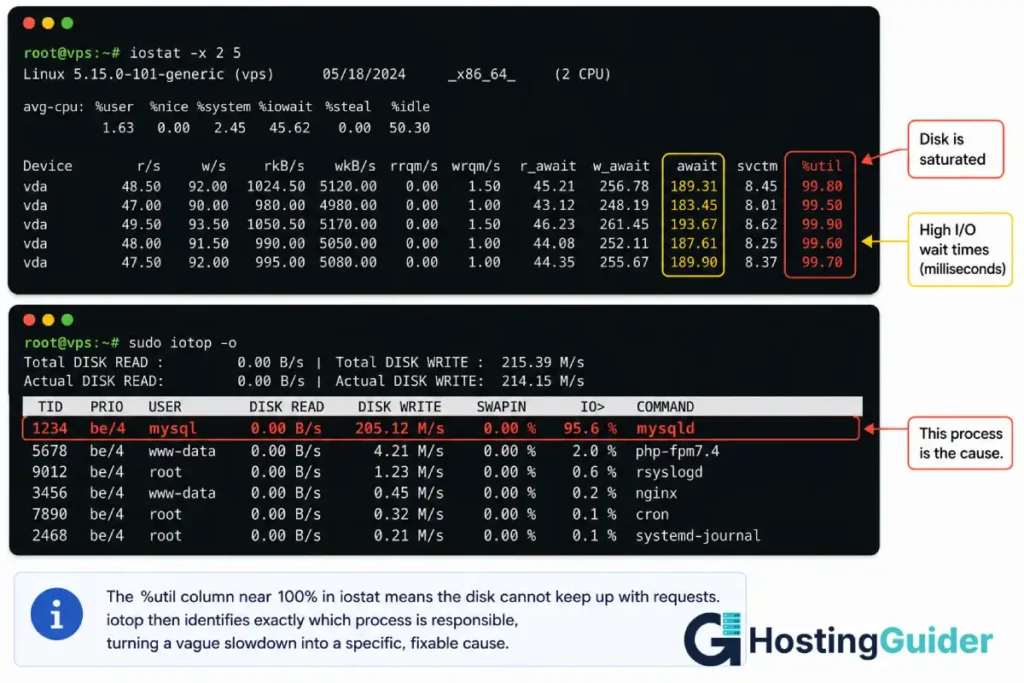
iostat -x 2 5
(This is part of the sysstat package installed earlier.) This prints extended disk statistics every 2 seconds, 5 times. Look at the %util column. This shows the percentage of time the disk was busy processing requests. A value consistently near 100% means the disk is saturated and cannot keep up with the requests being made of it.
Also look at await, which shows the average time (in milliseconds) for I/O requests to be served. On a fast SSD, this should be under 10ms typically. On a heavily loaded or slow disk, this can climb into the hundreds of milliseconds, meaning every disk operation takes a very long time.
To find which process is generating the disk activity, use iotop:
sudo apt install iotop -y
sudo iotop -o
The -o flag shows only processes that are actively doing I/O. Watch this for a minute. A database doing large writes, a backup process, a log file growing rapidly, or a search indexer rebuilding its index are common culprits.
What it looks like when your VPS is slow from disk I/O exhaustion: The server feels slow specifically during operations that read or write files: database queries, file uploads, log writes, cache writes. CPU usage might look moderate because processes are spending their time waiting for disk, not computing.
Common causes: A database performing large queries without proper indexes, causing excessive disk reads. A backup process running during business hours instead of off-peak. Log files that have grown enormous and are being written to constantly. A VPS on shared storage where “noisy neighbours” (other customers on the same physical storage) are consuming the available I/O. Swapping (covered in the memory section), which turns memory pressure into disk I/O pressure.
For database-heavy sites specifically, database query optimisation often resolves disk I/O issues faster and more cheaply than upgrading the server.
Check 4: Is Your VPS Slow Because of Network?
Network problems are the least common cause of a generally slow VPS but the most common cause of a specifically slow website with a fine-feeling server.
First, distinguish between two different problems: the server itself is slow to respond (which the previous three checks cover), or the server responds quickly but data takes a long time to reach the visitor (a network problem).
Check current network connections and their states:
ss -s
This gives a summary of socket states. Look at the number of connections in TIME-WAIT state. A very high number (thousands) can indicate the server is handling more connections than it can clean up efficiently, often from a high-traffic event or a misbehaving client repeatedly connecting.
Check bandwidth usage in real time:
sudo apt install nload -y
nload
This shows incoming and outgoing bandwidth in real time. If outgoing bandwidth is maxed out relative to your VPS plan’s allowance, large file downloads, video streaming, or a backup transfer could be saturating the connection.
Check for a high number of established connections, which can indicate either high legitimate traffic or an attack:
ss -tn state established | wc -l
If this number is unexpectedly high (thousands of connections for a site that normally has dozens), check where the connections are coming from:
ss -tn state established | awk '{print $5}' | cut -d: -f1 | sort | uniq -c | sort -rn | head -10
This lists the IP addresses with the most established connections. If a small number of IPs account for a huge share of connections, that traffic pattern looks more like a bot, scraper, or attack than normal visitor traffic. Our guide on server-side WAF versus plugin WAF covers how to filter this kind of traffic before it reaches your application.
What it looks like when your VPS is slow from network exhaustion: The server itself feels responsive over SSH and in top, but the website is slow specifically for visitors, or specific large file transfers are slow.
Common causes: The VPS plan’s bandwidth allowance is being exceeded, causing the provider to throttle the connection. A DDoS or scraping attack consuming connection slots. A misconfigured CDN or caching layer causing every request to hit the origin server directly. Large unoptimised media files being served without compression.
Check 5: Is Your VPS Slow Because of a Specific Process or Service?
If the first four checks did not point to a clear bottleneck, or if you want to identify exactly which application is responsible, this check ties everything together.
List all running services and their resource usage in one view:
sudo systemctl list-units --type=service --state=running
This shows every active service. Cross-reference this with the high-CPU or high-memory processes you found earlier using their process names.
For web servers specifically, check how many worker processes are running:
ps aux | grep -E 'nginx|apache|php-fpm' | wc -l
A very high number of PHP-FPM workers relative to available RAM is a common cause of memory exhaustion that then causes swapping that then causes everything to slow down. Each PHP-FPM worker consumes memory. If your configuration allows more workers than your RAM can support, the system runs out of memory under load.
Check your PHP-FPM configuration:
cat /etc/php/*/fpm/pool.d/www.conf | grep -E "pm.max_children|pm.start_servers"
A rough rule of thumb: pm.max_children should be set so that pm.max_children multiplied by the average memory per PHP process does not exceed the RAM available after accounting for the operating system, database, and other services.
For database servers, check the process list for long-running or stuck queries:
mysql -e "SHOW PROCESSLIST;"
(Adjust for PostgreSQL with SELECT * FROM pg_stat_activity; if using PostgreSQL.)
Look for queries that have been running for a long time (the Time column, in seconds). A query running for 300 seconds is either a genuinely huge operation or a query stuck waiting on a lock. Either way, it is consuming resources and likely blocking other queries.
Reading the Logs: The Real Story Behind Why Your VPS Is Slow
Commands show you the current moment. Logs show you the history, which often reveals patterns that a single snapshot misses.
Check the system log for errors and warnings around the time the slowness started:
sudo journalctl --since "1 hour ago" --priority=warning
This shows warnings and errors from the last hour across all services. Look for repeated errors, out-of-memory messages, disk errors, or service restarts.
Check your web server’s error log:
sudo tail -n 100 /var/log/nginx/error.log
(Replace with /var/log/apache2/error.log for Apache.) Repeated errors, especially related to upstream timeouts or worker process issues, point to application-level problems rather than infrastructure problems.
Check your application’s logs if you run one (WordPress, for example):
sudo tail -n 100 /var/log/php*-fpm.log
If you find a specific error repeated many times, search for that exact error message. A specific plugin error repeating thousands of times an hour is consuming resources every single time it fires, even if each individual occurrence seems minor.
The Most Common Reasons a VPS Is Slow and Their Fixes
Based on the checks above, here are the most frequent root causes of a slow VPS and what to do about each one.
A runaway or stuck process. Identified in Check 1 or Check 5. The fix: identify the process with ps aux or top, understand what it is (a script, a plugin, a cron job), and either fix the underlying bug or kill the stuck process with kill -9 [PID] as an immediate measure while you investigate the cause.
Memory exhaustion from too many PHP-FPM workers. Identified in Check 2 and Check 5. The fix: reduce pm.max_children in your PHP-FPM pool configuration to a number your RAM can support, then restart PHP-FPM:
sudo systemctl restart php-fpm
Database queries without indexes. Identified in Check 3 and the SHOW PROCESSLIST check. The fix: identify the slow query (most databases have a slow query log you can enable), add an appropriate index, and verify the query plan improves. This single fix often resolves disk I/O problems that look like they need a hardware upgrade.
Swapping due to insufficient RAM. Identified in Check 2. The fix in the short term: restart memory-heavy services to free RAM. The fix long term: either reduce memory usage (fewer services on one VPS, tuned configurations) or upgrade to a plan with more RAM. Swapping is rarely solvable by configuration alone if the workload genuinely needs more memory than the plan provides.
A backup or cron job running during peak hours. Identified in Check 1 and Check 3 if the slowness has a time pattern. The fix: check your crontab with crontab -l and reschedule heavy jobs (backups, log rotation, search indexing) to off-peak hours.
A compromised server running malicious processes. If you find an unfamiliar process consuming CPU, especially one with a random-looking name, running from an unusual location like /tmp, or making outbound connections to unfamiliar IPs, this could be a compromise. Check the process details:
ls -la /proc/[PID]/exe
This shows the actual executable file for a process, which can reveal if it is running from a suspicious location. If you suspect compromise, isolate the server, change all credentials, and consider a clean rebuild from a known-good backup.
When Your VPS Is Slow and the Diagnosis Says “Upgrade”
Sometimes the diagnosis is correct, the configuration is reasonable, and the honest conclusion is that the VPS plan is simply too small for the workload.
The signals that point to a genuine need for more resources rather than a fixable problem:
CPU is consistently above 80% during normal (not unusual) traffic, with no single runaway process, just many legitimate processes sharing genuinely high demand.
Memory is consistently near full with swap in active use, even after reducing unnecessary services and tuning configurations to reasonable levels.
Disk I/O is consistently saturated by legitimate database activity that has already been optimised (indexes in place, queries reviewed).
Traffic has grown organically and the resource usage has grown proportionally, not from a single anomaly.
If these signals are present, the fix is a plan upgrade: more CPU cores, more RAM, or faster storage (moving from standard SSD to NVMe, for example). Before upgrading, it is worth understanding what an upgrade actually changes. Our guide on bare metal versus virtualised dedicated servers explains the difference between scaling within a VPS plan and moving to dedicated hardware, which becomes relevant once a VPS workload outgrows shared virtualised infrastructure fully. If you are running the server yourself and the management burden is becoming a factor alongside the resource constraints, our overview of the skills needed for self-managed VPS hosting covers what ongoing VPS management actually involves.
Building a Baseline So You Catch a Slow VPS Early
The diagnosis process above works well after something is already slow. The better long-term approach is knowing what “normal” looks like for your server so you notice when something changes before it becomes a crisis.
Install a basic monitoring tool that records historical data, not just current snapshots:
sudo apt install sysstat -y
sudo systemctl enable sysstat
sudo systemctl start sysstat
This enables sysstat‘s data collection, which runs in the background and records system performance data automatically. After a day or two of normal operation, you can view historical CPU data:
sar -u
This shows CPU usage broken down by time of day, which establishes what your normal load pattern looks like. With this baseline, the next time something feels slow, you can compare current numbers against your normal pattern and immediately see whether the current state is genuinely abnormal or just a busy period that looks similar to other busy periods.
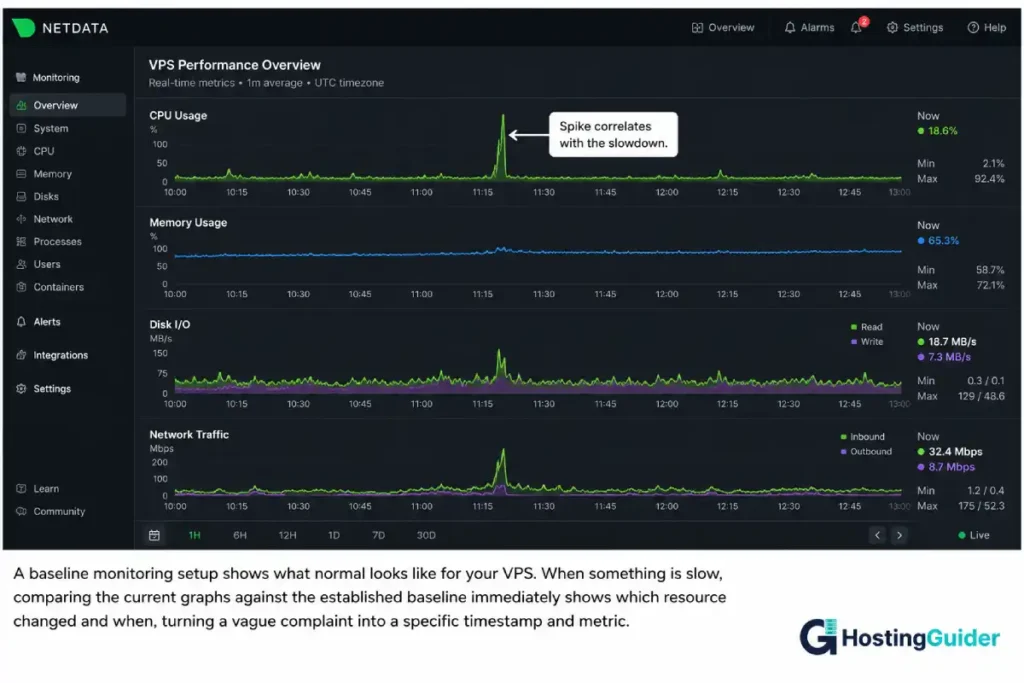
For a more visual approach, free tools like Netdata provide a real-time dashboard of every metric covered in this guide, updating every second, with historical graphs built in. This removes the need to run individual commands during a slowdown because the dashboard already shows the history leading up to the problem.
Frequently Asked Questions: When Your VPS Is Slow
My VPS Is Slow but the Dashboard Shows Low Usage. Why?
Hosting provider dashboards often show average usage over longer time periods (5 or 15 minute averages), which can hide short, intense spikes that cause noticeable slowness. They also typically do not show disk I/O wait time or swap usage in detail. Running the commands in this guide directly on the server, particularly vmstat, iostat, and free -h, shows real-time data that dashboards often smooth over or omit. A server can show “20% CPU” on a dashboard while experiencing repeated brief spikes to 100% that cause real slowdowns.
What is the difference between high CPU and high load average?
CPU usage shows how busy the processor is right now. Load average shows how many processes are using or waiting for the CPU, averaged over 1, 5, and 15 minutes, and it includes processes waiting for disk I/O as well as CPU. A server can have moderate CPU usage but a high load average if many processes are stuck waiting for slow disk operations. This is why checking both CPU and disk I/O together gives a clearer picture than checking either alone.
Is swap bad for a VPS?
A small amount of swap usage is normal and not a problem. Operating systems use swap to move rarely-accessed memory pages out of RAM to free space for active processes, which is efficient. The problem is active, heavy swapping, where the system is constantly moving data between RAM and disk because RAM is insufficient for the current workload. Heavy swapping causes severe slowdowns because disk access is dramatically slower than RAM access. Check free -h for swap usage, and if it is large and growing, that points to a memory shortage that needs addressing.
My VPS Is Slow. Should I Just Restart It?
A restart can provide temporary relief by clearing stuck processes, releasing memory leaks, and resetting connection counts. It does not fix the underlying cause. If a memory leak caused the slowdown, the same leak will recur over time after a restart. If a misconfigured cron job is the cause, it will run again on its schedule. A restart is a reasonable immediate step to restore service while you investigate, but the diagnosis steps in this guide should follow to find and fix the actual cause, or the problem will return.
My VPS Is Slow All the Time. How Do I Know if the Plan Is Too Small?
If you consistently find that CPU, memory, or disk I/O is near its limit during normal operation, after you have already optimised configurations (reduced unnecessary services, tuned PHP-FPM workers, added database indexes, scheduled heavy jobs for off-peak hours), then the plan is likely undersized for the workload. The key distinction is “after optimisation.” Many slow VPS situations are caused by configuration issues that make a correctly-sized plan behave like an undersized one. Work through the diagnosis and fixes in this guide first. If resource usage remains consistently high afterward, an upgrade is the correct next step.
My VPS Is Slow but My Server Looks Fine. Can the Hosting Provider Be the Cause?
Yes, in some cases. On VPS hosting, your virtual server shares physical hardware with other customers. If the physical host is overloaded by other tenants (“noisy neighbours”), your VPS can experience slowdowns in CPU or disk I/O that do not correspond to anything happening on your own server. The diagnosis commands in this guide will show your server’s own resource usage as normal in this case, while performance still feels slow. If your own diagnosis shows no clear cause but performance is still poor, contact your hosting provider and ask them to check the physical host’s load, or consider a provider known for stronger resource isolation.
My VPS Is Slow. What Single Command Shows Everything at Once?
top is the single best starting command because it shows load average, CPU breakdown, memory and swap usage, and the top processes by resource consumption all on one screen, updating in real time. For a slightly more detailed alternative with a friendlier interface, htop (install with sudo apt install htop) shows the same information with colour-coded bars and easier sorting. Either command, run first, often points directly at the bottleneck before you need any of the more specific tools in this guide.