Core Web Vitals are three specific measurements Google uses to judge how fast, responsive, and visually stable a webpage feels to a real visitor: Largest Contentful Paint (LCP), Interaction to Next Paint (INP), and Cumulative Layout Shift (CLS). A page passes when it meets the “good” threshold for all three at the 75th percentile of real visitor traffic.
Most guides to Core Web Vitals stop at that definition, list the thresholds, and hand you a checklist of front-end code fixes: compress your images, defer your JavaScript, set width and height on your ad slots. That advice is not wrong, but it skips the part that actually determines whether those fixes are enough.
Two of the three Core Web Vitals metrics are shaped heavily by how fast your server responds in the first place. No amount of image compression fixes a slow server.
In this article, you will learn:
- What each Core Web Vitals metric actually measures, in plain terms
- The exact 2026 “good,” “needs improvement,” and “poor” thresholds for LCP, INP, and CLS.
- How Google measures these scores using real visitor data, and why that differs from a lab test.
- How Core Web Vitals influence Google Search rankings, based on Google’s official documentation, and why they’re only one part of the overall ranking system.
- Current pass-rate data shows how many websites actually meet all three thresholds.
- The hosting-level factors, like server response time and PHP processing, that most Core Web Vitals guides skip entirely.
- Practical steps to improve each metric, split between what your host controls and what your code controls.
Key Takeaways
- Core Web Vitals measure three things: loading speed (LCP, good at 2.5 seconds or less), responsiveness (INP, good at 200 milliseconds or less), and visual stability (CLS, good at 0.1 or less), each scored at the 75th percentile of real visitor data.
- According to the 2025 Web Almanac from HTTP Archive, only 48% of mobile websites and 56% of desktop websites achieve a “good” score across all three metrics.
- LCP is the metric most sites fail on mobile, with only 62% of mobile pages meeting the “good” threshold, compared to 77% for INP and 81% for CLS.
- Google has stated directly that Core Web Vitals are one input into its page experience signal, not a dominant or standalone ranking factor.
- Server response time (TTFB) sets a hard floor under your LCP score. If your server takes 800 milliseconds to send the first byte, your page cannot possibly hit a 2.5-second LCP without a near-instant front end.
- Fixing hosting-level bottlenecks, like PHP-FPM configuration, OPcache, and caching, often improves Core Web Vitals scores more than front-end changes alone.
Quick Answer
Core Web Vitals are Google’s three field metrics for page experience: Largest Contentful Paint (LCP, loading), Interaction to Next Paint (INP, responsiveness), and Cumulative Layout Shift (CLS, visual stability). The current “good” thresholds are LCP under 2.5 seconds, INP under 200 milliseconds, and CLS under 0.1, each measured at the 75th percentile of real-world visits over a rolling 28-day period through Google’s Chrome User Experience Report (CrUX).
What Are Core Web Vitals?
Core Web Vitals are a set of three metrics Google defined to quantify real-world user experience on a webpage, covering loading performance, interactivity, and visual stability.
They are part of a broader group Google calls “page experience.” Google has directly stated that it recommends site owners achieve good scores for both search performance and general user experience.
The three metrics are:
- Largest Contentful Paint (LCP): how long it takes for the largest visible piece of content, usually a hero image or heading, to render on screen
- Interaction to Next Paint (INP): how long the page takes to visually respond after a user clicks, taps, or types
- Cumulative Layout Shift (CLS): how much visible content unexpectedly moves around while the page is loading or being used
INP replaced an older metric called First Input Delay (FID) in March 2024.
FID only measured the delay before a browser started processing the first interaction. INP measures the full responsiveness of every interaction across the entire page visit, which makes it a more complete and often less forgiving measurement.
The Three Core Web Vitals Thresholds Explained
Each metric has three performance bands: good, needs improvement, and poor. Google classifies a page or site by looking at the 75th percentile value across all real visits, meaning at least 75% of visits need to meet the “good” bar for the page to pass that metric.
| Metric | Good | Needs Improvement | Poor |
|---|---|---|---|
| Largest Contentful Paint (LCP) | 2.5 seconds or less | 2.5 to 4.0 seconds | More than 4.0 seconds |
| Interaction to Next Paint (INP) | 200 milliseconds or less | 200 to 500 milliseconds | More than 500 milliseconds |
| Cumulative Layout Shift (CLS) | 0.1 or less | 0.1 to 0.25 | More than 0.25 |
Source: Google web.dev, “How the Core Web Vitals metrics thresholds were defined”.
Largest Contentful Paint (LCP)
LCP marks the moment the largest content element in the visible viewport has finished rendering. For most pages, that element is a hero image, a background image, or a large block of text.
Google’s research team chose the 2.5-second “good” threshold by combining human-perception research on how long users wait before losing focus, roughly 1 to 3 seconds, with real-world achievability data from CrUX. That data showed 2.5 seconds was consistently reachable by well-optimized sites while still being a meaningful bar.
LCP is the metric most closely tied to server response time, since nothing on the page, including the LCP element itself, can begin rendering until the browser receives the HTML document from your server.
Interaction to Next Paint (INP)
INP measures the latency between a user’s interaction, like a click or a keypress, and the next time the browser visually updates the screen in response.
Unlike the old FID metric, INP samples interactions across the whole page visit and reports a high-percentile value. A single laggy dropdown menu or slow-loading comment box can drag down an otherwise fast page.
Google’s research settled on 200 milliseconds as the “good” threshold, based on perception studies showing that delays beyond roughly 100 to 200 milliseconds start to feel disconnected from the action that caused them, balanced against what was realistically achievable across the web.
Cumulative Layout Shift (CLS)
CLS scores how much visible content shifts position without warning, like a button that jumps down the page because an ad or image loaded above it.
It is calculated as a unitless score combining how much of the viewport shifted and how far it moved. A CLS of 0.1 or lower is considered good; anything above 0.25 is poor.
CLS is almost entirely a front-end and content-layout issue. Reserving space for images, ads, embeds, and web fonts before they load is the primary fix, and it has little to do with hosting speed.
How Are Core Web Vitals Measured?
Google measures Core Web Vitals using field data from the Chrome User Experience Report (CrUX), which aggregates real, anonymized performance data from actual Chrome users who have opted into usage statistics.
CrUX reports a rolling 28-day window of data, updated daily. Scores are calculated at the 75th percentile to avoid one unusually slow visit, like someone on a poor mobile connection, unfairly tanking a site’s classification.
This is different from lab data, which comes from running a single, controlled test through a tool like Lighthouse or PageSpeed Insights on one device under one set of network conditions.
Lab data is useful for debugging a specific page, but it is not what Google uses for ranking or for the Core Web Vitals report in Search Console. A perfect lab score and a “poor” field score can coexist on the same page, which is exactly why relying on a single PageSpeed test can be misleading.
You can check your own site’s Core Web Vitals through:
- The Core Web Vitals report in Google Search Console, which shows field data grouped by URL
- PageSpeed Insights, which shows both field data (when enough traffic exists) and a lab test
- The CrUX Dashboard or CrUX API, for bulk or historical analysis
If your site does not get enough Chrome traffic to appear in CrUX, Search Console and PageSpeed Insights will fall back to showing lab data only, labeled accordingly.
Do Core Web Vitals Affect Your Google Rankings?
Yes. Core Web Vitals are part of Google’s Page Experience signals, which Google uses as one of many ranking signals. However, they are not a dominant ranking factor, and Google has repeatedly stated that relevant, helpful, high-quality content is more important than page experience alone.
Core Web Vitals help Google evaluate how users experience a page after they arrive. Strong scores can contribute positively to overall page experience, but they do not outweigh content quality, relevance, or search intent. A page with excellent Core Web Vitals will not automatically outrank a more relevant page simply because it is faster.
That said, improving Core Web Vitals is still worthwhile. Faster, more responsive, and visually stable pages create a better experience for visitors, which can lead to higher engagement, lower bounce rates, and better conversion rates. Better hosting, efficient caching, optimized images, and cleaner code all contribute to these improvements.
It’s also important to remember that Core Web Vitals are only one part of technical SEO. Your hosting environment influences many other factors that affect website performance and search visibility, including server response time, uptime, crawlability, indexability, and overall site reliability.
If you’d like to understand the broader relationship between hosting and SEO, read our guide on How Hosting Impacts SEO and Search Rankings.
How Many Websites Actually Pass Core Web Vitals in 2026?
According to the 2025 Web Almanac’s Performance chapter, published by HTTP Archive using real CrUX data, pass rates for all three metrics combined have improved steadily but remain far from universal.
| Year | Mobile Pass Rate (All 3) | Desktop Pass Rate (All 3) |
|---|---|---|
| 2021 | 32% | 41% |
| 2023 | 36% | 48% |
| 2024 | 44% | 55% |
| 2025 | 48% | 56% |
Source: HTTP Archive, 2025 Web Almanac, Performance chapter.
Breaking that down by individual metric on mobile in 2025, 62% of pages achieved a good LCP score, 77% achieved a good INP score, and 81% achieved a good CLS score.
LCP is clearly the hardest metric to pass. That lines up with how tightly it is bound to server response time and network delivery, factors that front-end fixes alone cannot fully solve.
The Web Almanac data also shows that home pages consistently perform worse than secondary pages within the same site (45% good on mobile vs. 56% for secondary pages).
This is likely because home pages tend to carry more dynamic, frequently-changing content and heavier third-party scripts than templated interior pages.
The Hosting Factors Most Core Web Vitals Guides Ignore
Nearly every popular Core Web Vitals guide focuses on front-end fixes: compress images, defer scripts, reserve ad space. Those fixes matter, but they only address what happens after your server has already sent the page.
If your server is slow to respond in the first place, the fastest front end in the world still starts from behind.
Server Response Time (TTFB) Sets Your LCP Ceiling
Time to First Byte (TTFB) measures how long the browser waits between requesting a page and receiving the first byte of the response. It is not a Core Web Vital itself, but it is the first link in the LCP chain, since the browser cannot start rendering the LCP element until it has received the HTML that references it.
A 700-millisecond TTFB leaves your front end only 1.8 seconds to finish rendering the largest element and still hit a 2.5-second “good” LCP, and that gets harder on media-heavy pages. Where that time actually goes usually comes down to server configuration you can directly fix at the hosting level, from PHP handling to disk speed to how many other sites share your server’s resources.
PHP Processing and OPcache
For WordPress and other PHP-based sites, how your server executes PHP has a direct effect on TTFB. The choice between PHP-FPM and mod_php changes how efficiently your server handles concurrent requests.
Enabling OPcache avoids re-compiling the same PHP code on every single page load, which is one of the more overlooked, high-impact server-side fixes available.
Caching Layers
Server-side and page caching can turn a 1-second dynamically generated page into a 100-millisecond cached response. This is often the single biggest lever available for improving LCP on content-heavy or database-driven sites.
The different caching layers, from object caching to full-page caching, each solve a different part of that problem, and knowing which one applies to your setup matters more than turning on every option at once.
Database Query Performance
On dynamic sites, slow or inefficient database queries are a common, hidden cause of high TTFB, especially as a WordPress site grows in content, plugins, or traffic.
Sometimes the fix is query optimization, and sometimes it genuinely requires more server resources. Working out whether query optimization or a hosting upgrade actually solves it usually comes down to whether the slowdown scales with content volume or with traffic volume.
Server Location and CDN Configuration
Physical distance between your server and your visitor adds real, unavoidable network latency to every request. Server location plays a bigger role in load time than most site owners realize, especially for visitors far from your host’s data center.
A properly configured CDN can offload static assets to servers physically closer to your visitors, cutting load time for images, CSS, and JavaScript regardless of where your main server sits.
Storage and Protocol
The underlying storage on your server affects how fast data moves. NVMe storage reads and writes substantially faster than older SSD or spinning-disk storage, which speeds up everything from database queries to file delivery.
The network protocol matters too. HTTP/3 and QUIC support reduce connection setup time, which shows up most clearly on mobile connections with higher latency or packet loss.
None of these hosting-level factors show up in a Core Web Vitals checklist that only talks about image compression and JavaScript deferral, but for many sites, they are the difference between a page that can never hit “good” LCP and one that does with room to spare.
How to Improve Each Core Web Vitals Metric
Improving LCP
Start with the server side, since it sets the floor for everything else: reduce TTFB, enable caching, and use efficient PHP handling as covered above.
On the front-end side, the two highest-impact code-level fixes are compressing and correctly sizing images so the LCP element itself loads faster, and removing render-blocking CSS and JavaScript that delay it from appearing.
Improving INP
INP is almost entirely a front-end and JavaScript problem.
The most effective fixes are breaking up long-running JavaScript tasks so the browser can respond to user input between them, deferring non-critical scripts until after the page is interactive, and reducing how much JavaScript runs on every page in the first place, especially third-party scripts like ad tags, analytics, and chat widgets that you do not directly control.
Improving CLS
Set explicit width and height attributes, or aspect-ratio in CSS, on every image, video, and iframe so the browser reserves space before the content loads.
Use font-display strategies that avoid a visible layout jump when web fonts finish loading, and pre-allocate space for ads, embeds, and any content injected dynamically after the initial page render.
Why Core Web Vitals Are Worth Fixing Beyond Rankings
Google’s own Core Web Vitals business impact case studies document real, measured results from companies that improved these metrics.
Vodafone Italy improved LCP by 31% and saw an 8% increase in sales. Tokopedia improved LCP by 55% and saw a 23% increase in average session duration.
Multiple other case studies in the same collection show measurable gains in conversion rate, bounce rate, and ad revenue tied to Core Web Vitals improvements, independent of any ranking benefit.
These results are consistent with a simple pattern: visitors are more likely to stay, browse, and convert on a site that responds quickly and does not visually jump around while they are trying to use it.
What This Means If You’re Choosing a Web Host
If your site consistently fails LCP no matter how much you optimize images or defer scripts, the bottleneck is very likely your hosting, not your code. Before investing more time in front-end tuning, check your TTFB using PageSpeed Insights or a dedicated tool, and compare it against the roughly 200-millisecond TTFB you should expect from a well-configured, modern hosting setup.
Author’s Note: As the Founder of HostingGuider, I’ve reviewed many websites where the owner spent weeks compressing images and swapping fonts while a slow server response time went completely unaddressed. Fixing the hosting side of the equation usually improves LCP more than any front-end change on its own. Start with a solid hosting foundation, then optimize the front end from there.
If you are evaluating whether your current plan can support good Core Web Vitals scores, the full library of speed and infrastructure guides covers each of these factors in more depth.
Here is one of our websites, TikAdTools.com, as a real example of this in practice. Its latest PageSpeed Insights field data shows a “Passed” Core Web Vitals assessment on desktop, with LCP at 1.5 seconds, INP at 45 milliseconds, and CLS at 0.
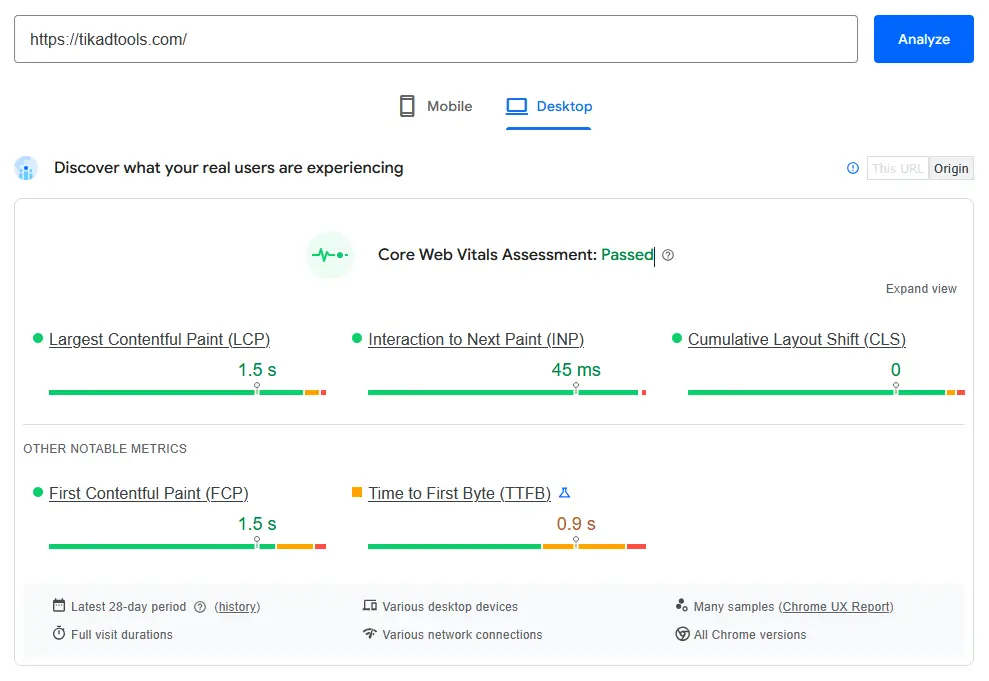
Its TTFB sits at 0.9 seconds, which actually falls in the “needs improvement” range rather than “good.” That still leaves enough of the 2.5-second LCP budget for a lean front end to finish rendering well inside the “good” threshold, which is exactly the kind of margin a slower, poorly configured hosting setup would not give you.
If you are evaluating whether your current plan can support good Core Web Vitals scores, the full library of speed and infrastructure guides covers each of these factors in more depth.
View the live test results on Google PageSpeed Insights
Any hosting terminology in this article that was unfamiliar is also covered in the web hosting glossary.
Frequently Asked Questions
What are Core Web Vitals?
Core Web Vitals are three Google metrics that measure real-world page experience: Largest Contentful Paint (LCP) for loading speed, Interaction to Next Paint (INP) for responsiveness, and Cumulative Layout Shift (CLS) for visual stability. A page passes when at least 75% of real visits meet the good threshold for all three metrics, based on Chrome browser data Google collects from actual visitors.
What is a good Core Web Vitals score in 2026?
A good Core Web Vitals score means Largest Contentful Paint (LCP) under 2.5 seconds, Interaction to Next Paint (INP) under 200 milliseconds, and Cumulative Layout Shift (CLS) under 0.1. Google measures these values at the 75th percentile of real visitor traffic through the Chrome User Experience Report (CrUX), not a single lab test on one device.
How do I check my website’s Core Web Vitals score?
Check your Core Web Vitals score through the Core Web Vitals report in Google Search Console, which uses real visitor field data grouped by URL, or through PageSpeed Insights, which shows both field data and a lab test. Search Console reflects actual visitor experience over time, while the PageSpeed Insights lab score reflects one simulated test run on a single device.
Are Core Web Vitals a Google ranking factor?
Yes. Core Web Vitals are a Google ranking signal because they are part of Google’s Page Experience signals. However, they are only one of many factors Google considers when ranking pages. Google has stated that relevant, helpful, and high-quality content remains far more important than Core Web Vitals alone. Improving Core Web Vitals can support search performance while also creating a faster, more responsive, and more stable experience for visitors.
What is LCP, and why does my page fail it?
Largest Contentful Paint (LCP) measures how long the largest visible element on a page, usually a hero image or heading, takes to render on screen. Most pages fail LCP because of slow server response time (TTFB), unoptimized images, or render-blocking CSS and JavaScript that delay the browser from displaying that element within the 2.5-second good threshold.
What is INP, and how is it different from FID?
Interaction to Next Paint (INP) measures how quickly a page visually responds to a click, tap, or keypress, and it replaced the older First Input Delay (FID) metric in March 2024. Unlike FID, which only measured the delay before the very first interaction, INP scores every interaction during a full visit, giving a fuller and often stricter picture of real responsiveness.
How do I fix Cumulative Layout Shift (CLS)?
Fix Cumulative Layout Shift by setting explicit width and height, or an aspect-ratio, on every image, video, ad slot, and embed so the browser reserves space before it loads. Use font-display strategies to prevent visible text jumps when web fonts finish loading, and avoid inserting new content above existing content after the page has already rendered.
Can better web hosting improve Core Web Vitals?
Better hosting can meaningfully improve LCP by lowering server response time (TTFB) through faster storage, efficient PHP handling, and caching, since nothing on a page can render until the server sends the first byte. Hosting has little effect on CLS, which is a layout issue, and only an indirect effect on INP, which depends mainly on JavaScript execution.
Conclusion
Core Web Vitals measure something real: whether your site loads quickly, responds promptly, and stays visually stable for actual visitors. The current thresholds, LCP under 2.5 seconds, INP under 200 milliseconds, and CLS under 0.1, are achievable, but 2025 Web Almanac data shows just under half of mobile sites and just over half of desktop sites currently meet all three.
Front-end fixes matter, but for many sites, especially on LCP, the bigger unlock sits at the hosting level: server response time, PHP handling, and caching. Fix the server first, then tune the front end, and you are working with the full picture rather than half of it.
Sources cited in this article:
- Google Search Central: Understanding Core Web Vitals and Google Search Results
- Google web.dev: How the Core Web Vitals Metrics Thresholds Were Defined
- Chrome for Developers: Chrome User Experience Report (CrUX)
- HTTP Archive: 2025 Web Almanac, Performance Chapter
- Google web.dev: The Business Impact of Core Web Vitals
- Google web.dev: Time to First Byte (TTFB)