
When a site slows down, most people upgrade their hosting plan.
It makes intuitive sense. More CPU and RAM should mean faster pages. So they move from shared hosting to a VPS, or bump from a 2GB VPS to 8GB, and wait for the improvement.
Sometimes it helps. Usually it does not. Because the bottleneck was never the hardware.
Most slow WordPress sites have one real problem: they run too many database queries, and those queries are not written efficiently. A server upgrade gives bad queries more resources to waste. Query optimization removes the problem entirely.
This guide shows how to find slow queries, fix the six patterns that cause most of the damage, and decide when a hardware upgrade actually is the right answer.
Key Takeaways
- A site running 200 database queries per page load is not a hardware problem
- The slow query log identifies every query taking longer than a threshold you set
- Missing indexes are the single most common cause of queries that run slowly on large tables
- The N+1 query pattern silently multiplies query count with every post or product added
- Object caching with Redis removes repeat queries entirely instead of running them faster
- Hardware upgrades help when the server is genuinely CPU or RAM constrained, not when queries are inefficient
Why Hardware Upgrades Do Not Fix Query Problems
A database query scans rows to find data. How many rows it scans depends on the query structure, not the server speed.
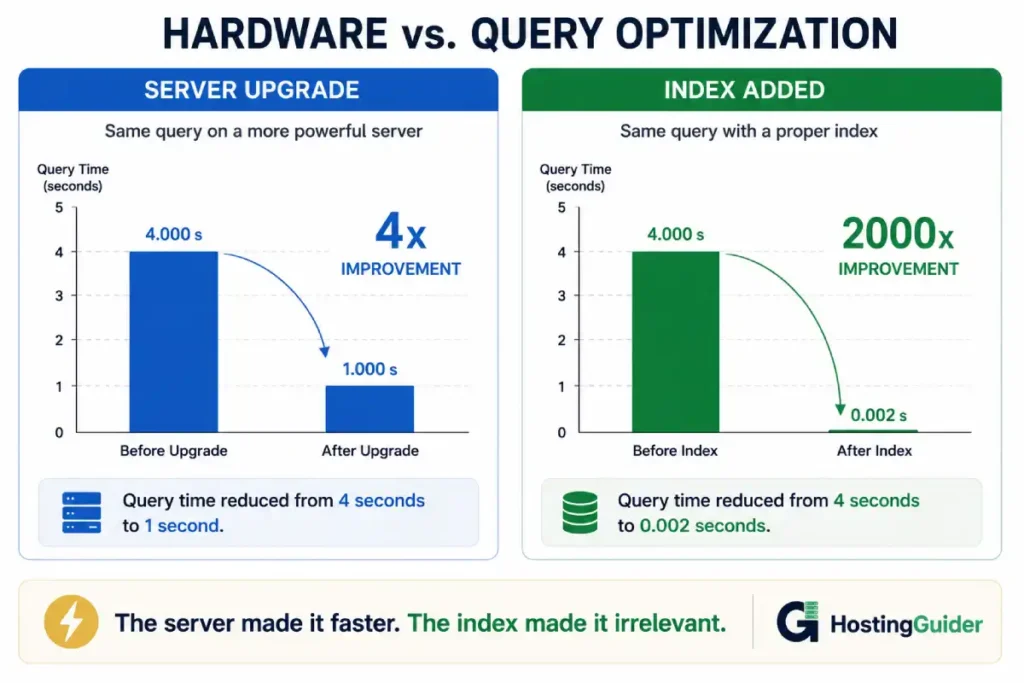
A poorly written query with no index on a 500,000-row table scans every single row to find the one it needs. On a slow server this takes 4 seconds. On a fast server it takes 1 second. On a correctly indexed table it takes 2 milliseconds on any server.
The index fix delivers a 2000x improvement. The server upgrade delivers a 4x improvement at most.
This is why query optimisation almost always outperforms hardware changes when queries are the bottleneck. The server becomes relevant only after the queries are efficient. At that point the server genuinely cannot go faster, and more hardware helps.
The practical implication: before spending money on a bigger hosting plan, spend 30 minutes identifying which queries are slow. The answer is usually instructive.
Step 1: Find Your Slow Queries
You cannot fix what you cannot see. Before touching any query, enable MySQL’s slow query log.
Connect to MySQL:
sudo mysql
Enable slow query logging for queries taking longer than 1 second:
SET GLOBAL slow_query_log = 'ON';
SET GLOBAL long_query_time = 1;
SET GLOBAL slow_query_log_file = '/var/log/mysql/slow-queries.log';
To make this survive a MySQL restart, edit /etc/mysql/mysql.conf.d/mysqld.cnf:
slow_query_log = 1
slow_query_log_file = /var/log/mysql/slow-queries.log
long_query_time = 1
log_queries_not_using_indexes = 1
The last line logs every query that runs without using an index, even if it is fast on a small table. This catches problems before they become visible as the table grows.
Browse your site normally for 15 minutes. Then check the log:
sudo tail -100 /var/log/mysql/slow-queries.log
Every entry in this file is a query that exceeded your threshold. The log shows the query text, the time it took, and how many rows it examined. A query examining 500,000 rows to return 10 results is a candidate for optimisation.
For WordPress, also install the Query Monitor plugin from the plugin directory. It shows every database query on each page load inside the WordPress admin toolbar, including which query came from which plugin and how long each one took.
Step 2: Use EXPLAIN to Diagnose Any Query
Once you have a slow query, EXPLAIN tells you exactly what MySQL is doing to execute it.
Take a query from your slow log. Run it with EXPLAIN in front:
EXPLAIN SELECT * FROM wp_posts
WHERE post_status = 'publish'
AND post_type = 'post'
ORDER BY post_date DESC
LIMIT 10;
The output is a table. The most important columns:
| Column | What It Tells You |
|---|---|
| type | How MySQL scans the table. ALL means full scan (bad). ref or range means index used (good) |
| key | Which index MySQL used. NULL means no index used |
| rows | Estimated rows scanned to produce the result |
| Extra | Extra information. Using filesort means slow sorting. Using temporary means a temp table |
MySQL’s official documentation on EXPLAIN output columns explains every value in detail. The ones to act on immediately are type: ALL with high rows, and key: NULL on any query that runs frequently.
The Six Query Problems That Cause Most Damage
Problem 1: Missing Indexes
An index is a sorted data structure that lets MySQL find rows without scanning the entire table. Without an index on a column used in a WHERE clause, MySQL reads every row.
Check existing indexes on the WordPress posts table:
SHOW INDEX FROM wp_posts;
Check existing indexes on the postmeta table:
SHOW INDEX FROM wp_postmeta;
The postmeta table is often the worst performer. WordPress stores everything in it: custom fields, plugin data, user preferences. On large sites it grows to millions of rows. Queries that filter by meta_key and meta_value without a proper index become table scans.
Add an index if one is missing:
ALTER TABLE wp_postmeta ADD INDEX meta_key_value (meta_key, meta_value(20));
This composite index covers queries that filter by both meta_key and meta_value, which covers the most common WordPress meta queries.
After adding the index, run the same EXPLAIN on the query. The key column should now show an index name instead of NULL, and rows should drop dramatically.
Problem 2: SELECT * Fetching Unnecessary Data
WordPress core frequently uses SELECT * which fetches every column from every matched row. For the wp_posts table with its 23 columns, this includes post_content which can be megabytes of text for long articles.
If a query only needs the post ID and post title, fetching the full post content wastes significant memory and transfer time between MySQL and PHP.
In custom queries, always specify the columns you need:
// Inefficient
$posts = $wpdb->get_results(
    "SELECT * FROM wp_posts WHERE post_status = 'publish' LIMIT 100"
);

// Efficient
$posts = $wpdb->get_results(
    "SELECT ID, post_title FROM wp_posts WHERE post_status = 'publish' LIMIT 100"
);
For WP_Query, use the fields parameter to limit returned data:
$query = new WP_Query([
    'post_type'   => 'post',
    'post_status' => 'publish',
    'fields'      => 'ids',  // Returns only post IDs
    'posts_per_page' => 100,
]);
Returning only IDs is dramatically faster for queries where you only need to know which posts exist, not their full content.
Problem 3: The N+1 Query Pattern
The N+1 problem is one of the most common performance killers on WordPress sites. It looks like this:
One query fetches a list of N posts. Then for each post, another query fetches something related (the author’s name, a custom field, a related category). Total queries: N+1.
With 10 posts on a page: 11 queries. With 100 posts: 101 queries. With a plugin that shows related posts and each related post fetches 3 extra pieces of data: 1 + (100 × 3) = 301 queries.
This is why plugin-heavy WordPress sites can run 200+ database queries on a single page load. Each plugin adds its own N+1 pattern on top of the ones already there.
Identify N+1 problems with Query Monitor. Look for groups of very similar queries that differ only in an ID value. Seeing the same query structure 47 times with different post IDs is the N+1 pattern.
The fix is to collect all the IDs first, then fetch the related data in a single query using IN:
// N+1 pattern (bad)
foreach ($post_ids as $id) {
    $meta = get_post_meta($id, 'product_price', true);
}

// Single query (good)
$meta_values = $wpdb->get_results(
    "SELECT post_id, meta_value FROM wp_postmeta
     WHERE meta_key = 'product_price'
     AND post_id IN (" . implode(',', array_map('intval', $post_ids)) . ")"
);
For WP_Query, enabling the update_post_meta_cache and update_post_term_cache parameters pre-loads meta and term data in bulk queries rather than fetching per-post:
$query = new WP_Query([
    'post_type'              => 'product',
    'posts_per_page'         => 50,
    'update_post_meta_cache' => true,
    'update_post_term_cache' => true,
]);
Problem 4: Meta Queries Without Proper Indexes
WordPress meta queries use meta_key and meta_value comparisons. These are among the most expensive query patterns when tables are large.
// This runs slowly on large tables
$query = new WP_Query([
    'meta_query' => [
        [
            'key'     => 'event_date',
            'value'   => date('Y-m-d'),
            'compare' => '>=',
            'type'    => 'DATE',
        ]
    ]
]);
EXPLAIN this query and look at the rows scanned. On a site with 50,000 products and their associated meta, this can scan millions of rows.
Solutions:
Add an index on meta_key:
ALTER TABLE wp_postmeta ADD INDEX key_value (meta_key(191), meta_value(100));
Or restructure the data. If a meta value is queried frequently as a range or comparison, consider storing it in a custom table with proper column typing and indexing instead of the generic meta table.
Problem 5: Queries Without LIMIT
A query with no LIMIT clause returns every matching row. If the query matches 50,000 rows and you only display 10, MySQL fetches all 50,000, PHP allocates memory for all 50,000, and 49,990 rows are immediately discarded.
In custom queries, always add LIMIT:
$results = $wpdb->get_results(
    "SELECT ID, post_title FROM wp_posts
     WHERE post_status = 'publish'
     ORDER BY post_date DESC
     LIMIT 10 OFFSET 0"
);
For WP_Query, posts_per_page is the LIMIT equivalent. Never set it to -1 on a public page. Use pagination instead.
Problem 6: Autoloaded Options Table Bloat
WordPress stores configuration data in the wp_options table. Many plugins set autoload = yes for their options, meaning every page load fetches all of those options in a single query before anything else runs.
Check how much autoloaded data your site carries:
SELECT SUM(LENGTH(option_value)) as autoload_size
FROM wp_options
WHERE autoload = 'yes';
The result is in bytes. Convert to kilobytes by dividing by 1024. Sites with over 1MB of autoloaded options pay a significant query cost on every single page load.
Find the largest autoloaded options:
SELECT option_name, LENGTH(option_value) as size
FROM wp_options
WHERE autoload = 'yes'
ORDER BY size DESC
LIMIT 20;
Identify options belonging to plugins you no longer use. Deactivate and delete those plugins. Their options often remain after deletion unless the plugin specifically removes them on uninstall.
For legitimate large options, change autoload to no if the plugin does not need the data on every page:
UPDATE wp_options SET autoload = 'no'
WHERE option_name = 'some_plugin_large_option';
Object Caching: Remove Repeat Queries Entirely
Optimising a query makes it run faster. Object caching with Redis removes it from the database entirely after the first run.
Redis stores query results in memory. When WordPress requests the same data a second time, Redis returns the cached result without touching MySQL. On a busy site where the same post or option is fetched dozens of times per minute, this eliminates the majority of database load.
Setting up Redis for WordPress object caching delivers the highest return per hour of work of any database optimisation technique. A site running 150 queries per uncached page load drops to 20 to 40 queries with Redis in place.
Install Redis and the phpredis extension on your server, then configure the Redis Object Cache plugin in WordPress. After enabling it, Query Monitor shows a hit/miss ratio in the database panel. A cache hit ratio above 90 percent means Redis is absorbing the vast majority of database work.
Measuring the Improvement
After any optimisation, measure the before-and-after with identical conditions.
Query Monitor shows the query count and total query time per page. Record these before optimisation. Apply the fix. Measure again on the same page in a fresh browser session.
Also run a timed load test to see end-to-end improvement:
for i in {1..10}; do
  curl -w "%{time_starttransfer}\n" -o /dev/null -s https://yourdomain.com/
done
The median TTFB should drop measurably after query improvements. If it does not, the bottleneck may be elsewhere — PHP execution time, network, or a different layer entirely.
For a systematic before-and-after comparison across all server layers, the benchmarking approach in this VPS performance guide covers which metrics to capture and what realistic improvement looks like.
When a Hardware Upgrade Actually Helps
Query optimisation is not the answer to everything. Hardware upgrades genuinely help in these situations.
Traffic volume, not query quality, is the bottleneck. If queries are efficient and the site still slows during traffic spikes, the server is handling more load than its resources support. More CPU and RAM helps here.
CPU-bound operations. WooCommerce checkout, image resizing, and complex page generation are CPU-intensive. A faster CPU reduces these times regardless of database optimisation.
MySQL needs more RAM for its buffer pool. The InnoDB buffer pool caches table data in RAM. If the buffer pool is smaller than your active dataset, MySQL reads from disk constantly. Increasing server RAM to allow a larger buffer pool delivers real improvement.
Check current buffer pool usage:
mysql -e "SHOW STATUS LIKE 'Innodb_buffer_pool_read_requests';"
mysql -e "SHOW STATUS LIKE 'Innodb_buffer_pool_reads';"
Divide Innodb_buffer_pool_reads by Innodb_buffer_pool_read_requests. If the ratio is above 1 percent, MySQL is frequently reading from disk instead of memory. A larger buffer pool — set in my.cnf as innodb_buffer_pool_size — reduces this.
When genuine hardware limits are the problem, the decision between VPS hosting tiers comes down to which resource is constrained. Scaling RAM when you need CPU, or scaling CPU when you need disk I/O, wastes money.
Frequently Asked Questions
How many database queries is too many for a WordPress page?
A well-optimised WordPress page with caching runs 15 to 40 queries. A page without caching on a normal site runs 50 to 100. Above 100 queries on an uncached page indicates inefficient code, usually from plugins. Above 200 is a serious problem that will degrade under moderate traffic regardless of server size. Query Monitor makes the count visible instantly. Start investigating anything consistently above 80 queries on pages you cannot full-page cache.
What is the fastest single change to reduce database load?
Enabling Redis object caching delivers the most immediate improvement for most WordPress sites. It requires installing Redis on the server and activating the Redis Object Cache plugin. After enabling it, the same data is served from memory on repeat requests rather than hitting the database. For a site running 100 queries per page on a busy day, Redis often drops effective database load by 60 to 80 percent within hours of enabling it.
Does query optimisation affect my database data?
Adding indexes does not change any data. An index is a separate data structure that MySQL uses to find rows faster. It adds some storage overhead (usually a few percent of table size) and slightly slows INSERT operations because MySQL must also update the index. For read-heavy WordPress sites, the read improvement far outweighs the write overhead. Changing autoload settings changes how options are loaded but not the values stored.
Can plugins cause N+1 query problems I cannot fix?
Yes. If a plugin generates N+1 queries and its code is not accessible to you, the options are limited. You can deactivate the plugin and replace it with something better. You can open a bug report with the plugin developer. You can use object caching to reduce the cost of the repeated queries. You can cache the plugin output at the page level if the data does not change per-user. What you cannot do is fix query patterns inside code you do not control.
When should I hire a database specialist instead of doing this myself?
When the slow query log shows queries you cannot understand, when EXPLAIN output shows complex query plans with multiple tables and temporary tables, or when your database size exceeds several gigabytes with active traffic, the optimisation work benefits from specialist knowledge. The tools are available to anyone, but interpreting complex execution plans correctly requires experience. For simple missing-index problems and N+1 patterns, the fixes in this guide are accessible to any developer comfortable with MySQL.