Uptime is the percentage of time a website works. Downtime is the percentage of time it doesn’t.
The two always add up to 100%. So 99.9% uptime is the same as 0.1% downtime. That’s about 43 minutes in a 30-day month.
That part is simple. Here’s the part that isn’t.
An uptime percentage only tells you the result of whatever measurement method was used.
It doesn’t tell you exactly what was measured.
It doesn’t tell you where.
It doesn’t tell you how often.
And it doesn’t tell you if any of that matches what your users actually went through.
Two sites can both post 99.9%. One worked fine for visitors nearly all month.
The other quietly failed on the one page that makes money. The number alone can’t tell you which is which.
Uptime vs downtime, the short version
- Uptime is the percentage of time a service is available. Downtime is the percentage it isn’t. They always add up to 100%.
- 99.9% uptime still allows about 43 minutes of downtime a month. That’s roughly 8 hours 46 minutes a year.
- An SLA number is a promise in a contract. It isn’t automatically what your visitors actually experienced.
- A homepage can work fine while checkout, login, or an API you depend on is broken.
- Whether something counts as downtime depends on how it’s measured. By time. By request. Or by whether the user finished what they came to do.
Uptime vs downtime at a glance
| Uptime | Downtime | |
|---|---|---|
| What it measures | Time the service works | Time the service doesn’t work |
| Better direction | Higher | Lower |
| How it’s shown | A percentage, like 99.9% | A percentage or a duration, like 43 minutes |
| How they relate | 100% minus downtime | 100% minus uptime |
What is uptime?
Uptime is the share of a time period when a website, app, or server works correctly. It’s usually shown as a percentage over a month or a year.
What is downtime?
Downtime is the period when a service is considered unavailable, under whatever measurement is being used.
That could mean fully offline, throwing errors, or failing to complete something it’s supposed to do.
Severe slowness sits in a gray area, it may or may not count as downtime depending on the definition in play, more on that further down.
Downtime and uptime describe the same stretch of time, just from opposite sides.
What does 99.9% uptime actually mean?
99.9% uptime means a service can be down for about 43 minutes in a 30-day month. Over a year, that’s roughly 8 hours 46 minutes.
This assumes uptime is measured across the whole period. Here’s the full table.
| Uptime | Downtime per year | Downtime per 30-day month |
|---|---|---|
| 99% | 3 days 15 hours | 7 hours 18 minutes |
| 99.9% | 8 hours 46 minutes | 43 minutes |
| 99.95% | 4 hours 23 minutes | 22 minutes |
| 99.99% | 53 minutes | 4 minutes |
| 99.999% | 5 minutes | 26 seconds |
These numbers are just math. They show what the percentage works out to in hours and minutes. They aren’t automatic legal guarantees.
What a provider actually owes you depends on their SLA. It depends on how the measurement period is defined. It depends on what’s excluded.
It depends on what the contract says you get if they miss the target. Two providers can both say 99.9% and still mean different things.
The fine print is where that difference lives, and we’ll get there further down.
Each extra nine cuts the allowed downtime by about ten times. Going from 99% to 99.9% is a jump most setups can reach. Going from 99.99% to 99.999% is a much bigger step.
It usually needs backup infrastructure and automatic failover, not just careful upkeep of one server.
How is uptime calculated?
Formula:
uptime % = (total time − downtime) / total time × 100
Simple example. A site was down for 2 hours in a 30-day month.
Total time in the month: 30 × 24 = 720 hours Uptime: (720 − 2) ÷ 720 × 100 = 99.72% Downtime: 2 ÷ 720 × 100 = 0.28%
You can also go the other way. Start from a percentage instead of hours. Subtract the percentage from 100. Apply that to the period you care about.
This is the version worth remembering. It turns a marketing number into hours you can actually picture.
Why an uptime percentage can be misleading
Picture a homepage that loads fine while checkout is broken. From a customer’s view, that site isn’t working. But a basic monitor watching only the homepage would still report 100% uptime.
That gap is the biggest problem with uptime numbers. It shows up in a few common shapes:
- Partial outages. One feature breaks while the rest of the site works. A broken cart. A broken login. A broken search box.
- Slow responses. A page that takes 20 seconds to load often isn’t counted as downtime. It technically returned a result. But it still lost you the visitor.
- Failed transactions. A form or checkout that looks fine but silently doesn’t submit. This is the hardest kind of failure for automated monitoring to catch.
- Regional outages. A site can work in one part of the world and fail in another. Often it’s a network routing issue, not the server itself.
- Dependency failures. Your site might depend on a database, a payment processor, or a third-party API. Any one of them can fail while your own server stays perfectly healthy.
If a monitor only checks one page every few minutes, its number tells you about the worst total outage. It doesn’t tell you if the site actually worked for real people.
What actually causes downtime?
Website downtime is usually caused by infrastructure failures, application errors, traffic overload, dependency failures, configuration mistakes, or human error. Here’s what each looks like.
Infrastructure problems: Hardware failure. Network failure. Power loss. A data center issue.
At well-managed hosting providers, individual hardware failures are often absorbed by redundancy, but larger infrastructure or network incidents can still cause real outages, and how often depends heavily on the provider, the scale, and the setup.
Application problems: A software bug. A memory leak. A crashed process. A configuration mistake in your own code or server setup.
Website-specific problems: A broken plugin. A theme conflict. A PHP error. A database connection failure. An expired SSL certificate.
For many self-managed WordPress and CMS sites, problems like these are a more common source of outages than the underlying server hardware.
Traffic problems: A sudden spike in real visitors. Unwanted bot traffic. A deliberate flood of fake requests.
All three can cause the same underlying problem: the server runs out of something it needs to keep serving people.
That could be CPU, memory, disk space, database connections, or available worker processes.
The server can be technically online the whole time while it’s unable to serve anyone new.
Dependency problems: Your DNS provider, your CDN, your payment processor, or a third-party API can fail.
Your own hosting can stay completely healthy the whole time. Your server being fine doesn’t mean your site is fine.
Human error: Deleting the wrong file. Changing a DNS record incorrectly. Deploying broken code. Editing a firewall rule badly.
Letting a credential or certificate expire unnoticed. This category causes more outages than most people expect.
It’s also the one most within your control, through better process, not more infrastructure.
Knowing which of these you’re facing is most of the battle. A hardware failure and a broken plugin look identical from the outside, just a site that won’t load.
But they’re fixed in completely different ways.
How a website can fail even when the server is up
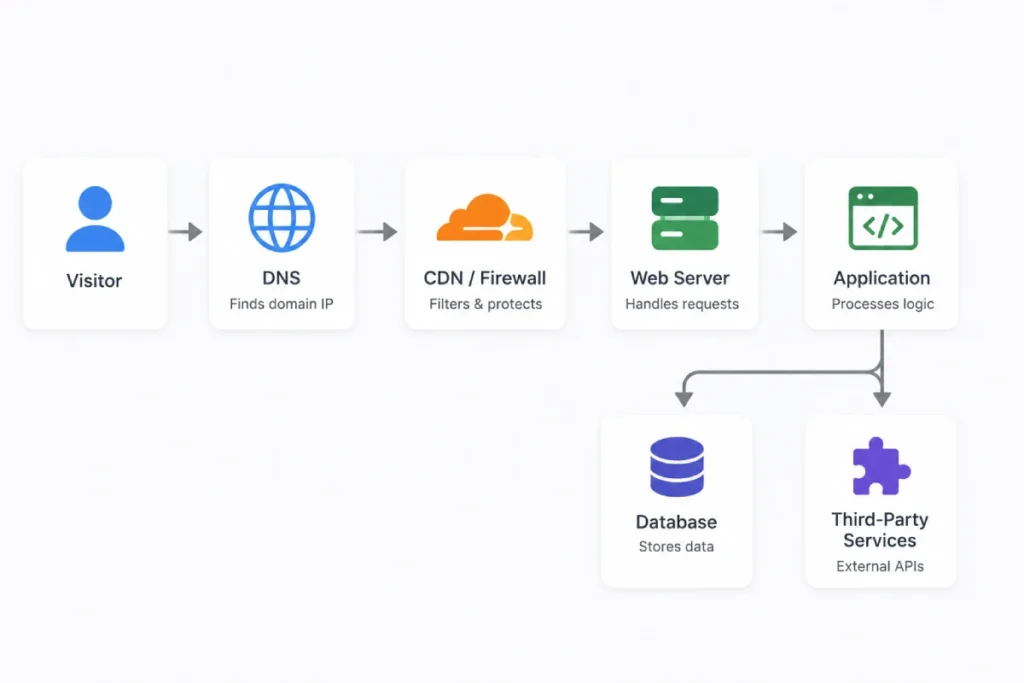
A website request passes through several layers before it reaches a visitor:
Visitor
  ↓
DNS
  ↓
CDN / firewall
  ↓
Web server
  ↓
Application
  ↓
Database
  ↓
Third-party services
A failure at any one of these layers can make part or all of the site unavailable, even when the hosting server itself is running normally.
This is a simplified map, not every request uses every layer, a site without a CDN skips that step, and most requests never touch third-party services at all. DNS pointing to the wrong place or a CDN outage can take the whole site down.
A payment processor failure usually only takes checkout down, while the rest of the site keeps working. Either way, the server underneath never has to have a single problem.
Not all downtime looks the same
Downtime comes in different shapes, and knowing the vocabulary helps you describe what’s actually happening.
- Complete outage. Nothing works, for anyone.
- Partial outage. One feature fails, like checkout or login, while the rest of the site works fine.
- Intermittent outage. The service works sometimes and fails other times, without an obvious pattern.
- Regional outage. Visitors in one location can’t reach the site, while others have no problem.
- Dependency outage. Your own infrastructure works, but a required external service fails.
- Performance degradation. The site technically responds, but it’s too slow to actually use.
- Planned downtime. Intentional maintenance, announced in advance.
- Unplanned downtime. An unexpected failure, with no warning.
If your site works sometimes and fails other times, that’s still an availability problem. It just doesn’t look like a typical outage.
Uptime vs availability vs reliability
Uptime and availability are closely related, and providers often use the two terms interchangeably.
In this guide, uptime refers to the percentage reported over a time period, while availability refers more broadly to whether the service meets a defined standard of usability, which may or may not include things like response speed.
Reliability is a separate idea again: how consistently the system operates without failure.
They get used like they mean the same thing. They don’t.
- Uptime. A simple way to express availability as one number. Just a percentage over a time period.
- Availability. The bigger idea behind uptime. Depending on how a provider defines and measures it, availability may or may not include things like response speed or whether specific features work. That depends on their own methodology, not on one universal definition.
- Reliability. How often failures happen in the first place, not just how much total time was lost.
This distinction matters in practice. Picture two sites. One goes down once a year for four hours. The other goes down fifty times a year for five minutes each.
Both can post nearly the same uptime percentage.
But one is a rare event, and the other fails constantly in small ways.
Those are different problems with different fixes, and the uptime number alone can’t tell you which one you’re looking at.
How is availability actually measured?
Most explanations skip this part. It’s actually the answer to why an uptime number can look great while your users are struggling.
Was the server up isn’t one question. It’s several questions stacked on top of each other. Each one can pass while the one above it fails.
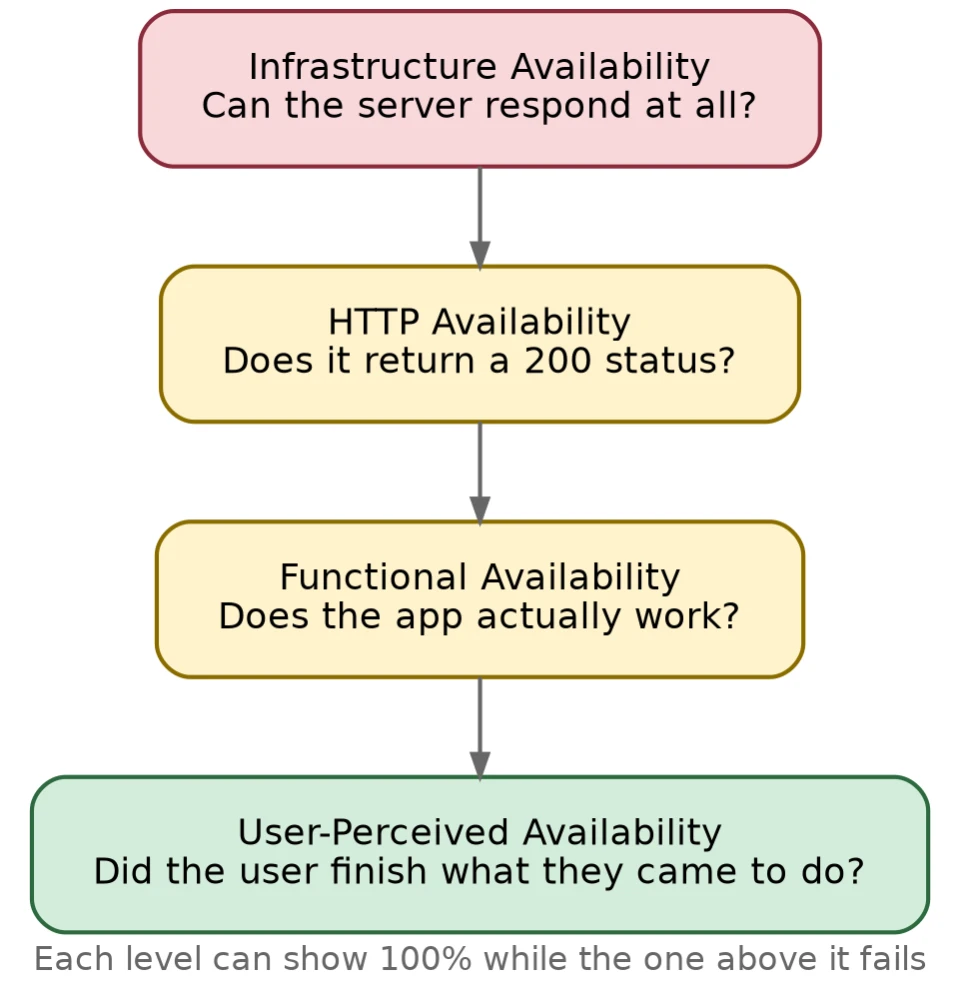
| Level | The question it answers | Can it show 100% while users are failing? |
|---|---|---|
| Infrastructure availability | Can the server or infrastructure respond at all? | Yes |
| HTTP availability | Does the page return a 200 status? | Yes |
| Functional availability | Does the application actually do what it’s supposed to? | Less likely |
| User-perceived availability | Did real users successfully complete what they came to do? | Best reflection of real impact |
A server can return a 200 and still be broken underneath. That’s exactly how a site posts a clean uptime number while login has been silently failing all afternoon.
There’s a second thing worth knowing. Availability can be measured by time, or it can be measured by request.
Time-based availability asks how long the service was down. Request-based availability asks what share of individual requests succeeded.
These can tell very different stories about the same incident.
Picture a ten-minute outage at 3am, when almost nobody’s using the site. Now picture a two-minute outage during a major sale. In time-based terms, those two outages look almost the same.
But if 20% of requests failed during those two minutes of peak traffic, the real damage is much worse than the time-based number suggests.
Time-based availability is simple to calculate, which is exactly why it’s common in public uptime guarantees and SLA reporting, even though providers may use different methods internally, and even though request-based availability often reflects real impact more accurately.
Does a slow or partially broken website count as downtime?
It depends on how the specific monitoring or SLA defines success. That varies by provider. Some definitions only require a valid HTTP response.
Stricter ones require a response within a time limit, or a fully completed transaction. Here’s how common situations typically compare under a basic definition.
| Condition | Technically available? | Customer impact |
|---|---|---|
| Normal page load | Yes | None |
| Very slow page (20+ seconds) | Often yes, if it eventually loads | High, most visitors leave |
| Homepage works, checkout fails | Yes for the homepage, no for the function | High, on the exact page that matters most |
| HTTP 500 or 503 error | No | High |
| DNS failure | No, from the visitor’s side | High, even though the server may be fine |
| Third-party payment processor fails | Depends on definition, the site itself may be up | High if payment is the point of the visit |
Whether any of these counts against an SLA is a contract question. It’s not something everyone agrees on by default. Read the SLA’s own definition of availability instead of assuming.
Going deeper: If you’re choosing hosting for a normal business site, the sections above cover what you actually need.
What follows explains how teams measure and monitor reliability in more detail.
It’s useful if you’re comparing providers closely, or if you’re the one responsible for keeping something running.
How do hosting providers measure uptime?
Synthetic monitoring is a common way to check website availability, though providers may use their own internal methods to calculate the SLA number itself, things like infrastructure telemetry or internal health systems, not necessarily a public-facing monitor.
A synthetic check is an automated request that visits one page on a set schedule, often every one to five minutes, and logs whether it got a valid response.
It’s a robot repeating the same simple check. Not a person watching the site.
A few things about the setup change what that number actually reflects:
- The interval. A check every five minutes can miss an outage that starts and fully recovers between two checks.
- The endpoint being checked. A monitor watching only the homepage won’t notice if checkout or login is broken.
- The monitoring location. A single check location can mistake a regional problem for the whole site being down, or the reverse.
- What counts as a pass. Some monitors only check the HTTP status code. Stronger setups check the actual page content, or walk through a full process, like adding an item to a cart and checking out. That catches failures a status-code check would miss entirely.
Synthetic monitoring is different from real user monitoring. Real user monitoring watches actual visitor traffic instead of an automated script.
Synthetic checks are cheap and consistent, but they only test the exact path someone configured. Real user monitoring shows what actually happened to real people, including failures a synthetic check would never touch.
But it needs real traffic to work in the first place, and it can offer little or no visibility when an outage stops users from reaching the site at all, which is exactly why it’s usually paired with synthetic monitoring, not used alone.
Monitoring itself can also fail to describe reality. It can produce a false positive.
That’s when the monitor reports the site as down while real users can still reach it. Often it’s a network problem at the monitoring location, or a firewall blocking the monitor’s own IP. It can also produce a false negative, which is worse.
That’s when the monitor reports success while something users actually need, like checkout or login, is failing.
A cached homepage can pass every check while the logged-in experience underneath it is completely broken.
What should you monitor?
Knowing the theory doesn’t tell you what to actually set up. It depends on what kind of site you’re running.
Minimum setup, any website:
- Homepage availability
- DNS resolution
- SSL certificate expiry
- Response time
Business website, add:
- Contact forms
- Login
- Search
E-commerce, add:
- Product pages
- Cart
- Checkout
- Payment confirmation
Application or SaaS, add:
- APIs
- Authentication
- Database health
- Background jobs
- Critical third-party dependencies
The pattern is simple: monitor whatever a customer actually needs to complete, not just whatever page happens to be easiest to check.
How often should you check? A rough starting point:
- Personal or low-traffic site: every 5-15 minutes
- Business website: every 1-5 minutes
- E-commerce or revenue-critical workflow: around 1 minute, plus transaction checks on the paths that matter
- Critical systems: frequency should follow your SLO and how fast you actually need to detect a problem
Shorter intervals catch failures faster, but they also mean more monitoring volume, and sometimes more cost. There’s no single right number, just a tradeoff to make deliberately instead of by default.
Uptime monitoring vs uptime guarantees
An uptime guarantee is a promise written into a contract.
Uptime monitoring is a measurement based on whatever checks that monitor actually runs, its own locations, its own intervals, its own paths. A provider’s own status page isn’t independent, since they’re grading their own homework.
A third-party monitor is a more useful outside view, but it still only reflects what its specific checks happened to test, not necessarily your whole site or every region your visitors are in.
A provider’s SLA might promise 99.9%. Their own status page, or a third-party monitor watching from outside, might show something different for a given month.
When the two disagree, the SLA decides what you’re owed. An external monitor is most useful when it tests the same locations and the same critical paths your actual users rely on, not just a homepage ping from one data center on the other side of the world.
What does an uptime SLA actually guarantee?
An uptime SLA guarantees a specific percentage over a specific measurement period, with a specific remedy if the provider misses it, and nothing beyond exactly what the contract states. It is only as good as its definitions.
Before you trust a headline percentage, check what the contract actually says about:
- Measurement period: Monthly and annual SLAs behave differently. A bad week disappears easily into a yearly average, but not into a monthly one.
- Covered services: Does the guarantee cover just the server? Or also DNS, the CDN, and anything else in the request path?
- Availability definition: What exactly counts as an outage under this contract, not under general industry use?
- Exclusions: Scheduled maintenance is commonly excluded, usually if advance notice was given.
Beyond that, whether DDoS attacks, emergency maintenance, or upstream failures count against the SLA depends entirely on that specific contract. There’s no standard answer across providers. - Customer-caused issues: Problems traced back to your own configuration are typically excluded, and that’s reasonable.
- Remedy: Most SLA violations pay out as a service credit toward future billing. Not as compensation for lost revenue.
- Claim process and caps: Some providers make you file a claim within a set window. Most credits are also capped as a percentage of the bill.
One distinction is worth stating plainly. Operational downtime and SLA-counted downtime are not the same thing.
- Operational downtime: The real hours your visitors couldn’t use the site. This counts every outage, planned or not.
- SLA-counted downtime: Only the downtime the contract agrees to count. Excluded categories, like scheduled maintenance, don’t show up here at all.
Your site being unavailable for two hours during scheduled maintenance can count as zero minutes of SLA downtime, because it was excluded by contract.
But it was still two full hours your actual visitors couldn’t use the site.
The SLA number describes what the provider is on the hook for. It doesn’t describe what your users experienced.
There’s no universal SLA. The headline percentage is a starting point, not the full picture. The exclusions section is usually where the real promise, or the real gap, lives.
SLI, SLO, SLA, and error budgets
| Term | What it is |
|---|---|
| SLI (Service Level Indicator) | The actual measurement, like the percentage of successful requests |
| SLO (Service Level Objective) | The internal target a team sets for itself, with no contractual weight |
| SLA (Service Level Agreement) | The contractual commitment, with a stated remedy if it’s missed |
An SLI doesn’t have to measure only uptime.
It can measure latency, error rate, or anything else that matters to the user. 99.9% of checkout requests completing successfully within two seconds is a stronger, more specific SLI than server uptime is 99.9%, because it ties directly to whether a real customer could actually check out.
The SLA is usually looser than the internal SLO. That’s because it carries financial and legal weight the SLO doesn’t.

A provider’s marketing page often reflects performance closer to their internal SLO. Their signed contract, the SLA, is the number that’s actually enforceable.
That’s the one worth judging them by.
There’s a related idea worth knowing: the error budget. Say a team sets an SLO of 99.9% availability over 30 days. The remaining 0.1%, about 43 minutes, is the error budget.
It’s the amount of unreliability the system can absorb while still meeting its own target.
An error budget isn’t permission to cause outages. It’s a way of deciding how much risk a team can spend. That risk goes toward deployments, experiments, or planned maintenance.
When the budget is healthy, the team can afford to ship faster and take more risk.
When it’s being burned through quickly, reliability work takes priority over new features until the budget recovers.
MTBF and MTTR
Two numbers explain what a single uptime percentage can’t. How often something breaks. And how fast it gets fixed.
MTBF (mean time between failures) measures how often failures happen. A higher MTBF means failures are rarer. It’s most useful when what counts as a failure is defined consistently.
A single component failing, a user-visible outage, and a failed transaction can each produce very different MTBF numbers, depending on which one you’re counting.
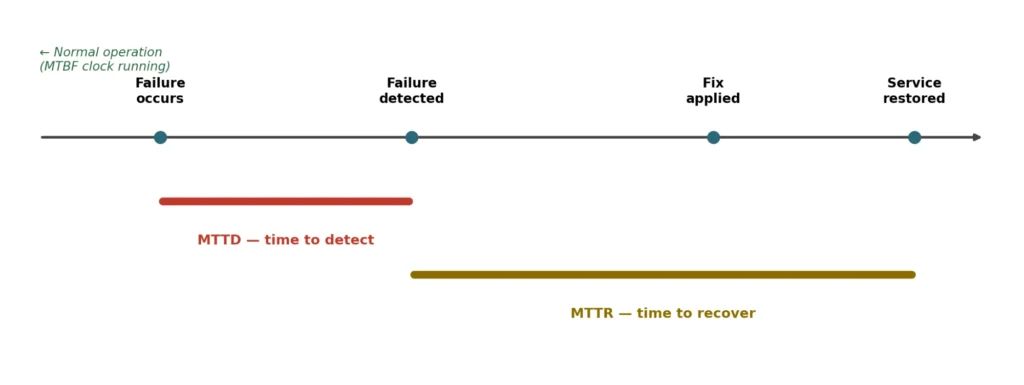
MTTR measures how long it takes to recover once something breaks. A lower MTTR means faster recovery. One thing worth knowing before you compare MTTR figures: it’s overloaded terminology.
Depending on who’s using it, MTTR can mean mean time to recovery, repair, respond, or resolve. Those clocks start and stop at different points.
Check what’s actually being measured before you compare two numbers that just happen to share an acronym.
These two goals aren’t in competition. A well-run system aims for both fewer failures and faster recovery, not one at the expense of the other.
But two systems can post the same uptime percentage while getting there in different ways.
One might rarely fail but take hours to recover when it does. The other might fail often but recover in seconds. The fix for each is different. Prevention for a low MTBF problem. Faster detection and response for a high MTTR problem.
There’s a third number that connects them: MTTD, mean time to detect. It measures how long it takes to notice a failure in the first place.
A system that takes an hour to notice an outage can’t recover quickly, even if the actual fix only takes five minutes, because the clock on MTTR hasn’t even started yet.
Monitoring and alerting are what shrink MTTD. Incident response is what shrinks the time from detection to recovery. They’re different jobs, and a fast team with slow monitoring still looks slow from the outside.
My website is down. What should I check?
Your own browser is the least reliable tool for this. Your DNS is cached. Your session might still be active.
A page that loads fine for you can be completely broken for everyone else. Work through it in order.
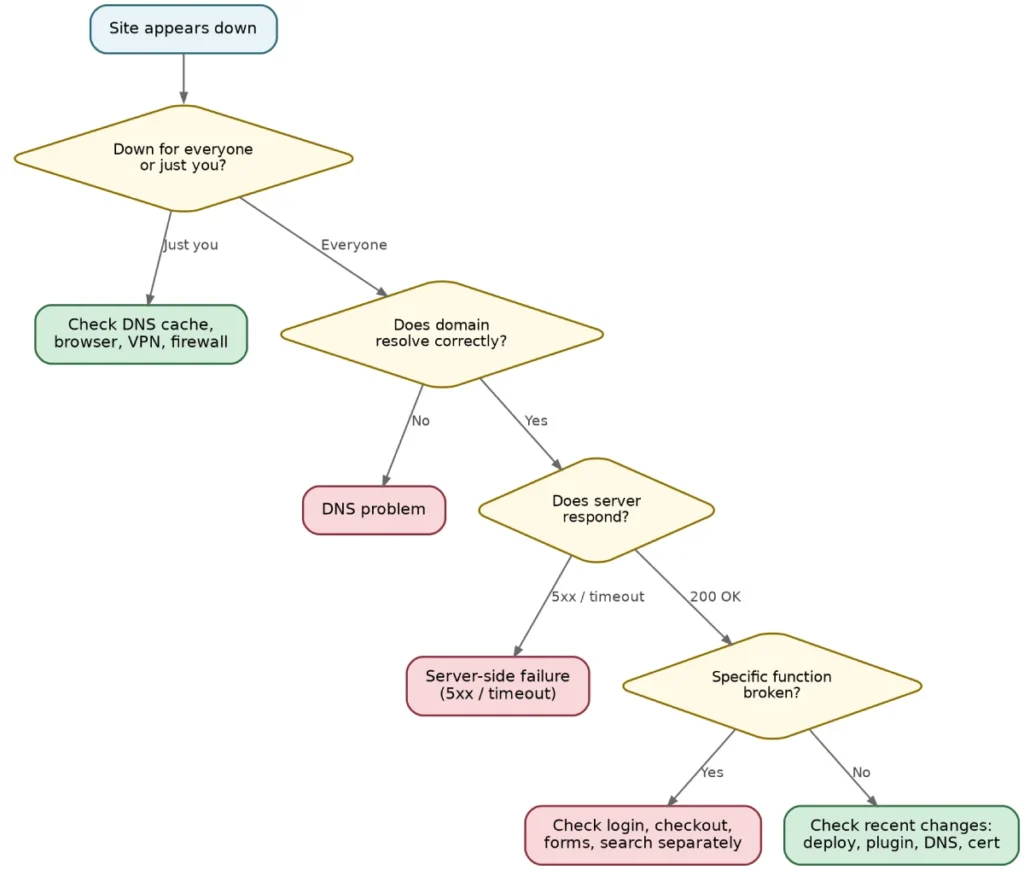
Step 1: Is it down for everyone, or just you?
Try a different network. Use mobile data instead of your usual wifi. Ask someone else to check. You can also try a multi-location uptime monitor, which tests from several places at once.
- If it’s fine elsewhere, the problem is local to you. Check your DNS cache, browser cache, VPN, or firewall before assuming anything is wrong with the site.
- If it’s down everywhere, move on to step 2.
Step 2: Does the domain resolve as expected?
Check DNS separately from the server. Running dig yoursite.com +short shows the address currently returned for the domain, if dig isn’t available on your system, nslookup yoursite.com does roughly the same job on Windows and most other setups. Compare that result with your intended configuration.
An empty or unexpected response can point to a DNS problem, but it doesn’t by itself prove exactly what’s wrong, a domain can use A records, AAAA records, CNAMEs, or CDN-based routing, and each behaves a little differently.
Treat this as a strong signal, not a final verdict, then keep going.
Step 3: Can the server respond?
Check the actual HTTP response with curl -I https://yoursite.com.
That sends a HEAD request, which checks the response headers rather than downloading the full page, and some servers or applications handle HEAD differently from a normal GET, so treat it as a quick signal, not proof the page content itself is fine.
A 5xx response usually means a server-side failure somewhere in the request path, that could be your web server, your application, or something further upstream like a CDN or reverse proxy.
A timeout, meaning no response at all, means the request didn’t complete in time, which could be a network problem, overloaded resources, a slow database query, or a dependency further upstream that’s taking too long to respond.
Here’s what the common codes usually mean, and where to start looking.
| Error | Usually means | First place to check |
|---|---|---|
| 400 | Bad request | The URL or request itself |
| 401 | Authentication required | Login or authentication flow |
| 403 | Access denied | Permissions or a firewall/WAF rule |
| 404 | Page not found | The URL or site routing |
| 429 | Too many requests | Rate limiting |
| 500 | Internal server or application error | Application logs |
| 502 | Upstream server problem | The backend behind your web server |
| 503 | Service unavailable | Overload or maintenance mode |
| 504 | Upstream timed out | Backend, database, or a slow dependency |
These aren’t universal rules. The same status code can come from different layers depending on your setup. But this is where to look first.
Step 4: Is the homepage working but a specific function broken?
Check login, checkout, forms, and search separately. Check anything that touches the database or a third-party service. A working homepage tells you almost nothing about whether these actually work.
Step 5: Did anything change recently?
A deployment. A plugin update. A DNS change. A certificate renewal. A firewall change made right before the outage started.
This is very often the actual cause. This one question resolves more incidents faster than any other step here.
If none of this points to something on your end, check your host’s status page. A known, ongoing incident on their side saves you from debugging something that was never yours to fix.
For a technical check, a couple of command-line tools go further than eyeballing a browser tab. A fuller check looks at both status and timing, not just the headers curl -I returns:
curl -s -o /dev/null -w "%{http_code} %{time_total}\n" https://yoursite.com
That returns the status code and how long the response took. This catches the case where a page technically loads but is too slow to be useful.
For DNS, dig yoursite.com +short shows what address the domain currently resolves to. Seeing an IP address only proves DNS returned a record.
It doesn’t prove that’s the correct address, or that the site is actually working. It’s also worth checking the bare domain and the www version separately, since they can resolve differently or point to different setups.
What to do when your website goes down
Finding the cause is only half the job. Once you know something’s wrong, work through it in this order:
- Confirm it’s real. Rule out a false alarm before you touch anything.
- Determine the scope. Everyone, or just one region? The whole site, or one feature?
- Find what changed recently. This is usually the fastest path to the actual cause.
- Mitigate first, diagnose later. Roll back, disable the broken piece, or switch to a backup, whatever restores service fastest, even before you fully understand why it broke.
- Restore normal service, and confirm it, don’t just assume the fix worked.
- Verify the real user journey. Check the actual page or feature that was broken, not just that the homepage loads.
- Review what happened. Once things are stable, figure out the root cause and what would prevent it next time.
Fixing the cause matters, but restoring service comes first. A permanent fix applied while customers are still locked out helps nobody faster than a quick mitigation followed by a proper fix once the pressure is off.
How to reduce downtime
Not every reliability practice pays off equally. Here’s roughly what helps fastest, in order.
- Monitor the paths that matter, not just the homepage. A check on your search or contact form catches failures a homepage ping never would.
- Get alerted fast. Fast detection limits how long a failure that still happens actually lasts. Prevention reduces how often those failures happen in the first place. You need both, and detection is the one that’s easiest to underinvest in.
- Test your backups, not just create them. A backup nobody has restored is unverified. It isn’t reliable.
- Roll out changes gradually, instead of pushing everything live at once. A few common patterns:
- Canary release. Send a small slice of traffic to the new version first. Watch it before rolling out further.
- Blue-green deployment. Keep the old version running alongside the new one. Switch traffic over once the new version is confirmed healthy.
- Rolling deployment. Replace servers or instances gradually instead of all at once. A bad release never takes down everything at the same time.
- Feature flags. Turn off a specific broken feature instantly, without redeploying the whole application.
- Plan for known traffic spikes. Use caching to absorb load before it becomes an emergency.
- Add redundancy and failover where it’s actually justified. This is useful, but it’s not the first thing to fix. A second server without monitoring or a tested failover process just adds another thing that can go wrong.
A backup isn’t the same as disaster recovery
Having a backup means you still have the data somewhere. It doesn’t mean you know how fast you can actually get back online.
Those are two different problems, and plenty of teams only discover the gap between them mid-outage, when the backup exists but nobody’s ever tried restoring from it under pressure.
Two numbers pin this down:
- RPO (recovery point objective). How much data you can afford to lose. An RPO of one hour means losing up to an hour of data is acceptable.
- RTO (recovery time objective). How long the service can stay down. An RTO of four hours means your recovery process has to actually finish within four hours, not just eventually get there.
A backup schedule tells you your theoretical RPO, hourly backups mean a theoretical worst case of losing an hour of data.
What it doesn’t tell you is whether you can actually hit that number, or your RTO, during a real incident.
Restoring for the first time while customers are locked out is a bad time to discover the process doesn’t work, or takes six hours instead of one.
Single points of failure
A single point of failure is any one component whose failure takes the whole service down with it. One server. One database. One DNS provider.
Doesn’t matter how well everything else is built, if that one piece goes, so does the site.
Adding a second server doesn’t actually fix this on its own. If both servers still hit the same database, sit in the same data center, or depend on the same DNS provider, you haven’t removed the single point of failure, you’ve just hidden it one layer down.
This is called a shared failure domain: components that look redundant on paper but can still fail together, because they depend on the same provider, network, database, or configuration underneath.
Real redundancy means checking what the two supposedly-redundant things still share.
High availability vs disaster recovery
People use these two terms almost interchangeably, but they’re solving different problems.
High availability is what keeps a service running when one piece of it fails, two servers behind a load balancer, so losing one doesn’t take down the site.
Disaster recovery is what gets you back after something bigger, restoring an entire environment from backup after you’ve lost it completely.
You can have great high availability and still get wrecked by a disaster you never planned for, and you can have a solid disaster recovery plan while your day-to-day setup falls over every time one server hiccups.
Neither one substitutes for the other.
How to choose a hosting provider based on uptime
Look past the headline percentage when you compare hosting providers. Check:
- The actual SLA, not the marketing number
- What the SLA’s exclusions cover
- How uptime is measured, and by whom
- The provider’s real incident history over the past year
- What the service credit actually is, and its cap
- Which components are covered: the server, but also DNS, the CDN, and anything else in the path
One distinction is worth stating clearly: hosting uptime is not the same as your entire website’s uptime. A hosting provider can keep its own infrastructure fully available while your site is still down.
None of the following is the host’s fault, and none of it shows up in the host’s uptime number, but all of it can take your site offline just as effectively:
- WordPress crashes
- A plugin breaks
- The database fails
- DNS is misconfigured
- Your CDN has a problem
- A payment processor goes down
- Your own code throws an error
The reason comes back to the request path covered earlier. Your site relies on hosting, DNS, a CDN, a database, a payment processor, and often third-party scripts, arranged so a failure in any single one breaks the experience for a real user, even if everything else is working perfectly.
Whatever number is printed on a host’s pricing page only covers their own layer of that chain.
What uptime target do you need?
There’s no single correct answer for every business. The honest way to answer it is to work out what an hour of downtime actually costs you. Lost revenue during that hour. Wasted ad spend still running while the site is broken. Staff time spent responding. Customers who don’t come back. Once that number exists, even roughly, the decision becomes concrete instead of aspirational.
| Target | When it fits |
|---|---|
| 99.9% | A reasonable baseline for most small and mid-sized business sites |
| 99.99% | Worth the added infrastructure cost if downtime has a direct, measurable cost per minute |
| 99.999% | A specific requirement for specific businesses, not a default goal |
If moving from 99.9% to 99.99% costs a predictable amount more per month, compare that against what your worst outage last year actually cost you.
Chasing an extra nine you don’t need mostly buys infrastructure complexity. Chasing one you do need, because outages genuinely cost you money, is worth paying for.
Before you sign an uptime SLA
- Check the provider’s actual incident history for the past 12 months, not just current status
- Read the exclusions section in full
- Check the measurement window, monthly is stricter than annual
- Find the remedy, and its cap
- Understand the claim process, some providers require you to request credits yourself
- Confirm exactly which components are covered, and which aren’t
FAQ
What is considered good uptime?
99.9% is a reasonable baseline for most business websites. Whether it’s good enough for you depends on how much an outage actually costs your business per minute.
How do I calculate downtime from an uptime percentage?
Subtract the uptime percentage from 100. Apply that to the period you care about. 100% minus 99.9% is 0.1%, which works out to about 43 minutes in a 30-day month.
What causes website downtime?
Most downtime comes from one of a few sources: infrastructure failure, application bugs, a broken plugin or theme, traffic spikes, a failed dependency like a payment processor, or human error. Human error causes more outages than most people expect.
Does a hosting uptime guarantee mean my website will always be online?
No. A host can maintain its own guaranteed uptime while your site is still down for reasons outside its infrastructure entirely. A plugin, your database, DNS, or a third-party service you depend on.
Can a website be up but not working?
Yes. A server can return a normal response, technically up, while the specific feature a visitor needs, checkout, login, search, is broken. Basic monitoring often misses this entirely.
How do I know if my website is down for everyone?
Check from a different network or device, or use a multi-location monitor that tests from several places at once. If it’s fine elsewhere, the problem is local to you, not the site.
What happens if a hosting provider misses its uptime guarantee?
Typically you’re owed a service credit toward future billing, not compensation for lost revenue. The exact remedy and its cap are defined in the SLA, not implied by the headline percentage.
What’s the difference between high availability and disaster recovery?
High availability keeps a service running when one part of it fails, like a second server picking up traffic automatically. Disaster recovery restores service after something bigger, like rebuilding an entire environment from backup. They solve different problems, and having one doesn’t mean you have the other.
Next time you see a headline uptime number
Ask what it’s actually measuring before you’re impressed by it. A percentage on a pricing page can’t tell you whether it came from a homepage ping every five minutes or from watching real logins succeed.
It can’t tell you what the SLA quietly excludes, or how the provider behaves at 2am when something breaks.
Pull up their incident history. Read the exclusions section, not just the percentage. Ask what happens if they miss the target, and check the cap on that credit.
That’s the version of due diligence that actually protects you, and it takes ten minutes longer than reading a sales page, which is exactly why most people skip it.