
TTFB is a number most people check and then do not know what to do with.
They run a test, see 900ms, read that it should be under 200ms, and start looking for a quick fix. They install another caching plugin. They upgrade their hosting plan. The number barely moves.
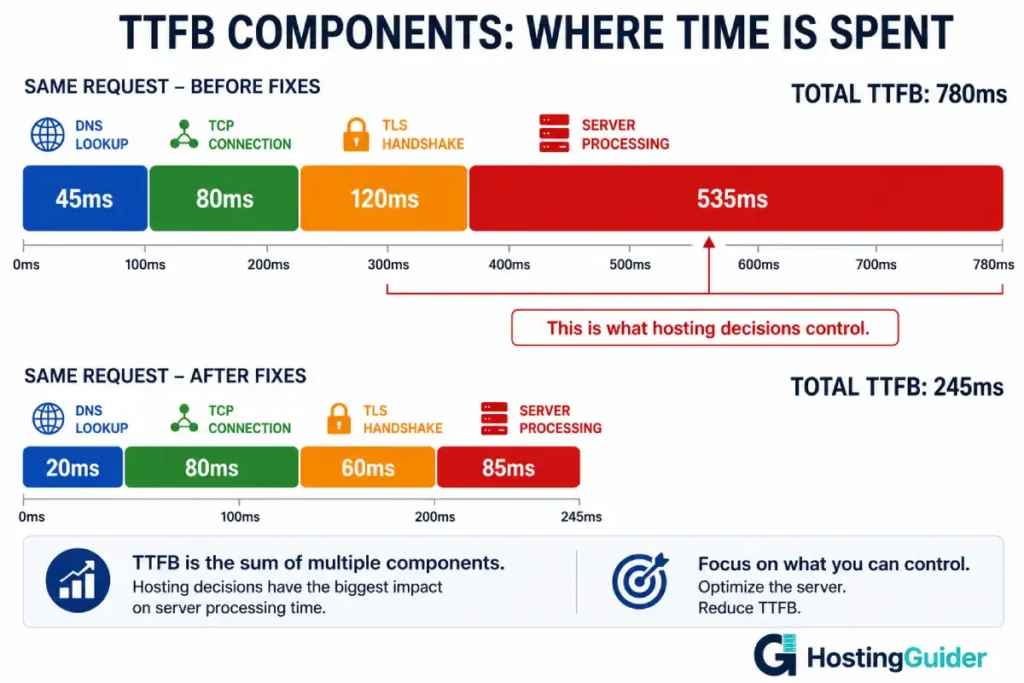
That happens because TTFB is not one thing. It is the sum of several smaller measurements. Fixing the wrong one wastes time. Fixing the right one can cut TTFB by 70 percent.
This guide breaks TTFB into its components, shows how to measure each one, and fixes them in the order that delivers the biggest improvement first.
Key Takeaways
- TTFB is the total time from a browser sending a request to receiving the first byte back
- It has four distinct components: DNS, TCP connection, TLS handshake, and server processing
- Server processing is the component hosting affects most, and it is almost always the biggest share of a slow TTFB
- PHP-FPM pool exhaustion adds queue wait time to every request and is one of the most overlooked causes of slow TTFB
- Page caching removes server processing time almost entirely for cached requests
- Fixing the wrong component produces no visible improvement — measure each component before choosing a fix
What TTFB Is Made Of
TTFB stands for Time to First Byte. It measures the time from when a browser sends an HTTP request to when the first byte of the server response arrives.
That time includes four separate stages:
DNS lookup. The browser needs to translate your domain name into an IP address. This can take 10ms on a fast DNS provider with a cached record, or 200ms on a slow provider with a short TTL.
TCP connection. The browser opens a connection to the server. The time depends on the physical distance between the visitor and the server. London to London: 2ms. London to Singapore: 160ms.
TLS handshake. HTTPS requires negotiating encryption before any data transfers. This adds one to two round trips before the browser gets any response.
Server processing. The server receives the request, runs PHP, queries the database, assembles the HTML, and starts sending back the response. This is the component hosting decisions control most directly.
A common tool for seeing all four components together is WebPageTest, which waterfall-charts each stage per request. For server-side diagnostics, curl gives a precise breakdown:
curl -w "DNS:     %{time_namelookup}s\nTCP:     %{time_connect}s\nTLS:     %{time_appconnect}s\nServer:  %{time_starttransfer}s\nTotal:   %{time_total}s\n" \
  -o /dev/null -s https://yourdomain.com/
Run this from multiple locations. The Server line shows pure server processing time. Everything above it is network overhead.
Run it five times and look at the Server value specifically:
for i in {1..5}; do
  curl -w "%{time_starttransfer}\n" -o /dev/null -s https://yourdomain.com/
done
If server processing consistently sits above 200ms, the fixes below apply. If it is under 100ms and total TTFB is still high, the problem is DNS, network distance, or TLS — covered toward the end of this guide.
Fix 1: Page Caching (Biggest Impact)
When a WordPress page loads without caching, PHP runs completely for every single visitor. WordPress core loads, plugins initialise, database queries run, templates render. On a typical site with 20 active plugins, this takes 200ms to 800ms.
With page caching, the first visitor triggers that full process. The output — plain HTML — is stored. Every visitor after that gets the stored HTML without PHP running at all. Server processing time drops from 400ms to under 20ms.
No other single change delivers this magnitude of improvement.
Setting up Nginx FastCGI cache (server-level, fastest):
Add to your Nginx configuration:
fastcgi_cache_path /var/cache/nginx levels=1:2 keys_zone=WORDPRESS:100m inactive=60m;
fastcgi_cache_key "$scheme$request_method$host$request_uri";
In the server block for your site:
set $skip_cache 0;

# Skip cache for logged-in users, POST requests, and WooCommerce
if ($request_method = POST) { set $skip_cache 1; }
if ($query_string != "") { set $skip_cache 1; }
if ($http_cookie ~* "wordpress_logged_in|woocommerce_cart") { set $skip_cache 1; }
if ($request_uri ~* "/wp-admin/|/wp-login.php|/cart/|/checkout/") { set $skip_cache 1; }

location ~ \.php$ {
    fastcgi_cache WORDPRESS;
    fastcgi_cache_valid 200 60m;
    fastcgi_cache_bypass $skip_cache;
    fastcgi_no_cache $skip_cache;
    add_header X-Cache $upstream_cache_status;
    # ... rest of your PHP settings
}
The X-Cache header now shows HIT or MISS on each response. A HIT means the page served from cache without touching PHP.
Alternative: WordPress plugin-based caching. WP Super Cache and W3 Total Cache both generate static HTML files that Nginx or Apache serve directly, bypassing PHP. Performance is slightly lower than FastCGI cache but requires no server configuration changes.
After enabling any page cache, re-run the curl timing test. The Server value for cached pages should drop to under 30ms.
Fix 2: PHP-FPM Pool Configuration
This is the most overlooked cause of slow TTFB.
PHP-FPM manages a pool of PHP worker processes. Each concurrent page load that requires PHP uses one worker. When all workers are busy, new requests wait in a queue. That queue time adds directly to TTFB.
A site with pm.max_children set to 5 and 10 simultaneous visitors needing PHP will keep the last 5 waiting. Their TTFB includes queue time plus actual processing time.
Check current PHP-FPM pool status:
sudo cat /etc/php/8.1/fpm/pool.d/www.conf | grep "^pm"
Check current active connections against the pool limit:
curl -s http://127.0.0.1/fpm-status 2>/dev/null || \
  sudo grep -i "pm.status_path" /etc/php/8.1/fpm/pool.d/www.conf
If pm.status_path is configured, visit it through your web server for live statistics including active, idle, and queued processes.
The right pool configuration for a 4GB VPS:
pm = dynamic
pm.max_children = 30
pm.start_servers = 5
pm.min_spare_servers = 5
pm.max_spare_servers = 20
pm.max_requests = 500
Calculate pm.max_children based on available RAM. Each PHP-FPM worker uses roughly 30 to 80MB depending on what plugins are loaded. Divide your available RAM (after MySQL, Nginx, and system overhead) by the average worker size.
For a 4GB server with 1.5GB available after other services: 1500 / 50 = 30 workers.
Apply the change:
sudo systemctl restart php8.1-fpm
Test under load:
ab -n 200 -c 30 https://yourdomain.com/
If TTFB drops after increasing the pool size, the pool was the bottleneck.
The kernel tuning parameters that control connection backlog work together with PHP-FPM pool sizing. A large pool paired with a small connection queue still drops requests under traffic spikes.
Fix 3: Object Caching with Redis
Page caching skips PHP entirely for anonymous visitors. Object caching helps the server process pages faster for everyone else — logged-in users, WooCommerce customers, admin users.
Redis stores the results of database queries in memory. When WordPress needs the same data again, Redis returns it without a MySQL query. On a plugin-heavy site, this cuts the number of database queries from 100+ down to 20-40 per page load.
Install and configure Redis:
sudo apt install redis-server php8.1-redis -y
sudo systemctl enable redis-server
sudo systemctl start redis-server
Set a memory limit in /etc/redis/redis.conf:
maxmemory 256mb
maxmemory-policy allkeys-lru
In WordPress, install the Redis Object Cache plugin and add to wp-config.php:
define('WP_REDIS_HOST', '127.0.0.1');
define('WP_REDIS_PORT', 6379);
define('WP_REDIS_TIMEOUT', 1);
define('WP_REDIS_DATABASE', 0);
Enable from the plugin settings. After activation, use the Query Monitor plugin to verify the database query count dropped. Server processing time in the curl test should also decrease.
Fix 4: PHP OPcache Tuning
Every PHP file loads, parses, and compiles on every request unless OPcache is configured. OPcache stores compiled bytecode in memory so PHP skips the compilation step on repeat requests.
Check OPcache is enabled and tuned:
php -i | grep -E "opcache.enable|opcache.memory_consumption|opcache.max_accelerated_files"
The defaults are often wrong for WordPress. A 20-plugin site can have 15,000+ PHP files. The default max_accelerated_files of 10000 fills and stops caching the rest.
Edit or create /etc/php/8.1/fpm/conf.d/10-opcache.ini:
opcache.enable=1
opcache.memory_consumption=256
opcache.max_accelerated_files=20000
opcache.validate_timestamps=1
opcache.revalidate_freq=60
opcache.save_comments=1
opcache.jit=1255
opcache.jit_buffer_size=128m
Restart PHP-FPM to apply:
sudo systemctl restart php8.1-fpm
Fix 5: Database Query Performance
A slow database is a slow server processing time. When MySQL takes 400ms to respond to queries, TTFB cannot be under 400ms regardless of everything else.
Enable the slow query log to find the culprits:
sudo mysql -e "SET GLOBAL slow_query_log = 'ON'; SET GLOBAL long_query_time = 0.5;"
This logs every query taking over 500ms. Browse your site for a few minutes, then read the log:
sudo tail -50 /var/log/mysql/slow-queries.log
The most common fix is missing indexes. Run EXPLAIN on any slow query to see whether it is doing a full table scan:
EXPLAIN SELECT * FROM wp_postmeta WHERE meta_key = 'your_key';
If the output shows type: ALL and rows: 500000, that query scans every row. An index on meta_key cuts it to milliseconds.
ALTER TABLE wp_postmeta ADD INDEX meta_key (meta_key);
The relationship between database queries and hosting performance shows that a single index addition frequently outperforms doubling server resources. Server processing time in TTFB is almost always a query problem before it is a hardware problem.
Fix 6: InnoDB Buffer Pool
MySQL keeps frequently-used table data in a memory area called the InnoDB buffer pool. When the pool is full, MySQL reads from disk instead. Disk reads take milliseconds. Memory reads take microseconds.
The default buffer pool size is often just 128MB. A WordPress site with millions of rows across the options, postmeta, and posts tables benefits from much more.
Check how often MySQL hits disk instead of memory:
mysql -e "SHOW STATUS LIKE 'Innodb_buffer_pool_reads';
SHOW STATUS LIKE 'Innodb_buffer_pool_read_requests';"
Divide reads by read_requests. If the ratio is above 1 percent, the buffer pool is too small.
Increase it in /etc/mysql/mysql.conf.d/mysqld.cnf:
innodb_buffer_pool_size = 1G
Set this to roughly 70 percent of available RAM on a server where MySQL is the primary workload. Restart MySQL:
sudo systemctl restart mysql
Fix 7: DNS Response Time
Every browser request to your site starts with a DNS lookup. If your DNS provider responds slowly, TTFB starts late.
Measure your DNS response time:
dig yourdomain.com | grep "Query time"
Run this 10 times. DNS lookups under 20ms are good. Anything above 50ms consistently suggests a slow DNS provider.
The fastest DNS providers for authoritative hosting are Cloudflare DNS (usually under 10ms), AWS Route 53, and Google Cloud DNS. If your domain registrar handles DNS, their response times are often far slower than a dedicated DNS provider.
Moving DNS to Cloudflare is free and takes about 30 minutes. The improvement in perceived TTFB for first-time visitors and for visitors with expired DNS caches can be significant.
Also check your DNS TTL. A TTL of 300 means DNS resolvers re-check your IP every 5 minutes. Most records can safely use a TTL of 3600. Visitors with fresh DNS cache pay no DNS cost at all.
Fix 8: TLS Session Resumption
The TLS handshake adds one to two round trips before any data transfers. For visitors who have connected before, TLS session resumption skips this cost by reusing the previously negotiated session.
Configure Nginx for optimal TLS session handling:
ssl_session_cache shared:SSL:10m;
ssl_session_timeout 1d;
ssl_session_tickets off;
The ssl_session_cache stores session parameters for 1 day. A returning visitor whose session is cached skips the full handshake. The ssl_session_tickets off setting disables session tickets in favour of server-side session IDs, which are more consistently supported across clients.
Also confirm TLS 1.3 is enabled. TLS 1.3 completes the handshake in one round trip instead of two:
ssl_protocols TLSv1.2 TLSv1.3;
The impact of the TLS layer on TTFB is explored in more depth in the HTTP/3 and QUIC guide — QUIC’s main advantage is eliminating this handshake entirely for returning connections.
Reload Nginx after changes:
sudo nginx -t && sudo systemctl reload nginx
Fix 9: Server Location and CDN Edge Termination
TCP connection time is set by physics. Light travels at a finite speed. London to Singapore adds roughly 170ms of round-trip latency. No server configuration fixes this.
The fix is to move the connection termination point closer to the visitor. A CDN terminates the TLS connection at the nearest edge location. The visitor in Singapore connects to a Cloudflare edge in Singapore (8ms), not your London origin server (170ms).
The TCP and TLS components of TTFB drop dramatically for international visitors when a CDN is in front of the origin. Server processing time is still determined by the origin, but all the pre-processing overhead shrinks to near zero.
Check where Cloudflare is connecting visitors from:
curl -sI https://yourdomain.com/ | grep CF-Ray
The three-letter code at the end of the CF-Ray value is an airport code showing the edge data centre. AMS is Amsterdam. SIN is Singapore. If your London visitors are hitting SIN, something is misconfigured in Cloudflare routing.
Misrouted CDN traffic adds latency instead of removing it. The patterns that cause CDN setups to harm performance rather than improve it are worth checking before assuming the CDN is configured correctly.
Measuring the Improvement
After each fix, measure with the same curl command:
curl -w "DNS: %{time_namelookup}s | TCP: %{time_connect}s | TLS: %{time_appconnect}s | Server: %{time_starttransfer}s\n" \
  -o /dev/null -s https://yourdomain.com/
Run it 10 times and take the median Server value. Apply one fix at a time so the contribution of each change is visible.
Google considers server response time (the server component of TTFB) good at under 200ms. For the full TTFB including network latency, under 800ms qualifies as good in Core Web Vitals scoring.
Target sequence: fix page caching first. Re-measure. Fix PHP-FPM pool if uncached pages are still slow. Re-measure. Add Redis. Re-measure. Tune OPcache and database. Re-measure. Address DNS and TLS last as they have the smallest marginal improvement once the server side is clean.
What looks like a hosting limitation on PageSpeed scores is often a server processing time that caching and pool tuning would eliminate entirely before any hardware upgrade is needed.
Frequently Asked Questions
What is a good TTFB for a WordPress site?
Google’s Core Web Vitals guidance considers server response time good at under 200ms and poor above 600ms. For the complete TTFB including DNS and connection overhead, under 800ms is the good threshold. A WordPress site with full-page caching enabled should show server processing time well under 100ms for cache hits. Uncached pages on a well-tuned server typically fall in the 150 to 300ms range depending on database complexity.
Why does my TTFB vary so much between tests?
Variable TTFB usually points to three causes. First, PHP-FPM pool exhaustion during concurrent requests adds queue wait time that varies with traffic. Second, shared hosting load balancing routes your test to different servers with different loads. Third, database queries that sometimes hit the cache and sometimes miss produce different times. Run 10 consecutive tests and compare. Wide variance is almost always PHP-FPM or shared-hosting-related. Consistent but slow TTFB points to underlying query or PHP execution performance.
Can I improve TTFB without server access?
Partially. DNS provider changes are made through your domain registrar, not your hosting panel. A Cloudflare CDN setup improves the DNS and TLS components for international visitors and is configured through Cloudflare, not the server. These two changes together can shave 100 to 300ms from TTFB for distant visitors without touching the server. The server processing component — usually the largest share of slow TTFB — requires either server-level changes or switching to a host that pre-configures caching, Redis, and proper PHP-FPM pools. Hosts like Kinsta, Cloudways, and Rocket.net configure most of these fixes by default.
Does upgrading to a faster CPU or more RAM improve TTFB?
Only when the CPU or RAM is genuinely the bottleneck. A server at 90 percent CPU load will see TTFB improvement from more CPU. A server at 30 percent CPU with slow TTFB caused by unindexed database queries will see no improvement from more CPU. Measure server CPU and RAM utilisation during the slow period before upgrading. If utilisation is under 60 percent, the bottleneck is almost certainly code, queries, or configuration — not hardware. Fix those first.
How does TTFB affect SEO rankings?
Google uses server response time as a signal in Core Web Vitals, which is a confirmed ranking factor. The Largest Contentful Paint metric cannot be fast if TTFB is slow, because the browser cannot start rendering until it receives the first bytes. A 600ms TTFB effectively adds 600ms to every Core Web Vitals timing. Sites consistently above 600ms server response time score Needs Improvement or Poor on CWV, which affects their ranking in competitive search results.