A 429 Too Many Requests error means a rate limit was hit somewhere between a visitor and your WordPress database, and it can be generated by several different systems along that path: your CDN, your firewall, your web server, PHP itself, or WordPress and its plugins. Guessing at a fix without knowing which one is responsible wastes time.
This guide starts with how to identify the source, then covers the fix for every common cause, including several most guides skip entirely.
Key Takeaways
- A 429 means a rate limit was hit somewhere between the visitor and WordPress, not that your server crashed.
- Plugins, especially security plugins, cause the majority of 429 errors on WordPress sites.
- A single curl command or your browser’s network tab usually tells you which layer generated the block.
- The Heartbeat API, XML-RPC, and PHP-FPM exhaustion are three overlooked causes rarely covered in generic troubleshooting lists.
- If Googlebot is the one being blocked, it shows up in Search Console before most visitors ever notice.
Quick Answer
A WordPress 429 Too Many Requests error means a server, CDN, firewall, plugin, or host has temporarily blocked requests because a rate limit was exceeded.
Identify which layer generated the response using curl -I or your browser’s Network tab, then apply the matching fix instead of guessing: deactivate plugins one by one if it’s WordPress-level, adjust firewall or CDN rules if it’s Cloudflare or Sucuri, or tune limit_req in Nginx if it’s the web server itself.
If you only have 5 minutes: Run
curl -I yoursite.com. If you seecf-rayorserver: cloudflare, jump to Fix 10. If you see nothing unusual, deactivate all plugins and test (Fix 1) before anything else.
Troubleshooting Priority
Work through these in order. Each one takes a couple of minutes and rules out an entire category of cause.
| Check | Time |
|---|---|
curl -I header check | 30 seconds |
| Check Wordfence/security plugin live traffic | 2 minutes |
| Check Cloudflare Security Events | 3 minutes |
| Deactivate all plugins and test | 5 minutes |
| Review server error logs | 5 minutes |
Jump to a Fix
Jump to:
- Plugin Conflicts (Fix 1)
- Theme Conflicts (Fix 2)
- Security Plugin Limits (Fix 3)
- Heartbeat API (Fix 4)
- XML-RPC Requests (Fix 5)
- Mixed HTTPS Content (Fix 6)
- WP-Cron & REST API (Fix 7)
- PHP-FPM Limits (Fix 8)
- Nginx / Apache / LiteSpeed Configuration (Fix 9)
- Cloudflare / CDN Rate Limiting (Fix 10)
- WooCommerce AJAX Requests
- Googlebot & Search Engine Crawlers
What’s Most Likely Causing Yours
Based on how these cases typically break down:
- Plugins and their built-in security rules: the most common cause by a wide margin
- Firewall or security plugin rate limiting (Wordfence, Sucuri, and similar): the next most frequent
- CDN or WAF rules (Cloudflare, Bunny, others): common on sites behind a CDN
- Web server or PHP-FPM configuration: less common, usually shows up under real traffic spikes
- Hosting-level limits: the least common, and the hardest to fix without contacting support
Match Your Symptom to a Cause
| What You’re Seeing | Most Likely Cause |
|---|---|
| Only wp-login.php or wp-admin fails | Brute-force traffic, security plugin rule (Fix 3) |
| Only checkout fails, browsing is fine | WooCommerce admin-ajax.php burst (WooCommerce section) |
| Everyone gets blocked, all pages | CDN or web server rate limit (Fix 9, Fix 10) |
| Only wp-admin, intermittent | Heartbeat API (Fix 4) |
| Random visitors, no clear pattern | Shared IP behind a misconfigured proxy (see the proxy chain note above) |
| Only Googlebot in Search Console | Crawler-specific WAF rule (see the Googlebot section) |
What Normal Traffic Looks Like
A rough sense of scale helps before you start worrying about volume:
| Activity | Typical Request Count |
|---|---|
| One page load | 20–40 requests (assets, fonts, tracking scripts included) |
| WooCommerce checkout | 50–150 requests across the full flow |
| Heartbeat API, 4 open editor tabs | Hundreds per hour |
| An actual bot or brute-force attack | Thousands per minute against a single endpoint |
If your logs show something closer to the last row, you’re looking at abuse, not a false positive worth loosening a rule over.
Can I Just Ignore It?
Not every 429 needs immediate action. A rough guide:
- One isolated 429 after refreshing repeatedly? Ignore it. Likely a one-off rate-limit edge case.
- 429 appearing every hour or so, no clear trigger? Worth investigating, but not urgent.
- 429 affecting checkout or a core conversion path? Treat as critical and start diagnosing immediately.
- 429 affecting Googlebot in Search Console? Treat as urgent. Crawl budget lost here compounds over time.
Before You Do Anything Else
It’s tempting to immediately clear the cache, reinstall WordPress, or reboot the server. None of these usually help.
A cache clear doesn’t touch a server-side rate limit, a reinstall doesn’t change plugin behavior, and a reboot resets nothing about CDN rules, firewall state, or plugin configuration, since those all live outside the server process itself.
Run the header check below first. The full list of things to avoid entirely is in the Mistakes to Avoid section later in this guide.
Fast Answers
Does a plugin cause 429?
Yes, most often. Deactivating all plugins and reactivating them one at a time (Fix 1) is the fastest way to confirm this.
Does Cloudflare generate 429s on WordPress?
Yes, when a rate-limiting or WAF rule is tuned too aggressively for your traffic. A cf-ray header in the response confirms Cloudflare is the source.
Can my host cause a 429 I can’t fix myself?
Yes. Managed hosts sometimes apply platform-level limits that need a support ticket to adjust.
Will a 429 error hurt my SEO?
Only if it’s happening to Googlebot specifically, not just human visitors. Check Search Console’s crawl stats to confirm.
What a 429 Error Actually Means
What is a 429 error? A 429 Too Many Requests error means a server or intermediary intentionally rejected a request because a predefined rate limit was exceeded.
Who generates a 429? A 429 can be generated by Cloudflare, a web server, ModSecurity, a security plugin, WordPress code itself, or the hosting provider’s own edge firewall.
How do I know which system generated it? Check the response headers with curl -I or your browser’s Network panel. Headers such as cf-ray, server, or x-wf-block usually identify the source directly.
What causes a 429 error in WordPress specifically? A WordPress 429 error occurs when a CDN, firewall, web server, hosting platform, plugin, or custom code temporarily blocks requests because a predefined request limit has been exceeded.
How do you fix a 429 error? Identify which layer generated the response using HTTP headers or logs, then adjust that layer’s rate-limiting configuration or remove the source of excessive requests, rather than disabling the protection outright.
A 429 status code tells a client that it sent too many requests in too short a time, and that this particular one is being rejected. It’s a deliberate, intentional response, not a bug or a crash.
The 429 status code exists in the HTTP specification specifically so servers can reject excessive request rates without implying anything is broken.
RFC 9110, which defines current HTTP semantics, describes it as a signal to slow down, distinct from an error that means the server failed. That distinction matters when you’re deciding whether to treat an incident as an outage or as a protection mechanism working correctly.
This is different from other errors that look similar on the surface. The table below breaks down how a 429 compares to its closest neighbors.
| Error | Meaning | Typical WordPress Cause |
|---|---|---|
| 403 | Forbidden | Permissions, blocked IP, or a WAF rule |
| 404 | Not found | Missing page or broken permalink |
| 429 | Too many requests | Rate limit hit at some layer |
| 500 | Internal server error | PHP fatal error or plugin conflict |
| 502 | Bad gateway | Upstream server (PHP-FPM, proxy) not responding |
| 503 | Service unavailable | Server overload or maintenance mode |
| 504 | Gateway timeout | Upstream server too slow to respond |
A 429 is intentionally temporary, existing to protect the server or application from excessive request rates rather than to signal that anything has failed.
Many servers include a Retry-After header that tells the client exactly how long to wait before trying again.
A 503, by contrast, usually points to genuine server overload rather than a deliberate limit.
How Rate Limiting Works
A request to your WordPress site passes through several layers before it reaches your database, and any one of them can generate a 429 independently.
A typical stack looks like this:
Browser
   │
CDN / WAF (Cloudflare, Sucuri)
   │
Load Balancer (on managed or cloud hosting)
   │
Web Server (Nginx or Apache)
   │
ModSecurity (if enabled)
   │
PHP-FPM
   │
WordPress core
   │
Plugin or theme code
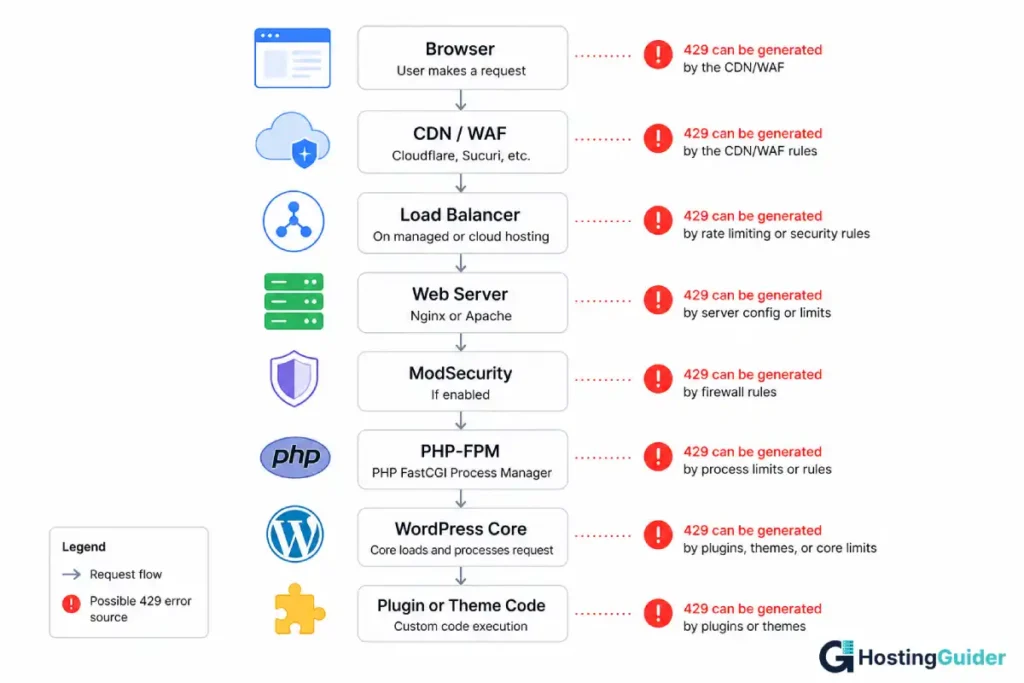
The table below is the fastest way to narrow down which layer is responsible for yours.
| Layer | How to Identify It | Typical Fix |
|---|---|---|
| Cloudflare | cf-ray header present, Server: cloudflare | Adjust Rate Limiting rules |
| Sucuri | Server: Sucuri/Cloudproxy | Whitelist IP or adjust firewall sensitivity |
| Nginx | Entry in error.log, no plugin headers | Tune limit_req zone |
| Apache | Entry in error.log, mod_ratelimit active | Adjust rate limit module config |
| Security plugin | Custom header like X-WF-Block (Wordfence) | Whitelist IP, raise threshold |
| LiteSpeed | X-LiteSpeed-Cache header, LSCache dashboard | Increase rate limit in LiteSpeed settings |
| Host-level | No headers, confirmed by support | Request a raised limit or upgrade plan |
Many managed hosts also run a proprietary edge firewall on top of this stack, separate from Cloudflare or anything WordPress controls. Hostinger, A2, ScalaHosting, Rocket.net, ChemiCloud, and Liquid Web are a few examples.
If your headers and logs don’t clearly point anywhere, ask support directly whether platform-level rate limiting is active before assuming the cause lives in your own configuration.
Multiple proxies compound this. A common setup is Cloudflare in front of an AWS load balancer forwarding to Nginx and PHP, and each proxy can apply its own limit.
The server header from curl -I tells you where the request stopped: server: cloudflare means it never reached your origin, while server: nginx means it did and something downstream rejected it.
Two more headers help in a multi-proxy setup: Via, which lists each proxy the request passed through, and X-Forwarded-For, which shows the original client IP as each proxy saw it.
A common misconfiguration: If Nginx sits behind Cloudflare but a security plugin like Wordfence isn’t configured to trust Cloudflare’s IP range, every visitor can appear to Wordfence as the same address, often
127.0.0.1.One visitor tripping the limit then blocks everyone behind that proxy at once, since they all look identical to the plugin. Most security plugins have a trusted proxy or real IP header setting specifically to fix this.
Limits are also scoped to a specific key, not just a raw count, and that key determines who actually gets blocked:
| System | Common Scoping Keys |
|---|---|
| Cloudflare | IP address, ASN, country, URI path, request header, cookie, HTTP method |
| Wordfence | IP address, login attempts per username, per logged-in user |
Nginx limit_req | $binary_remote_addr (per IP) by default, but can key on $http_x_forwarded_for or a custom variable |
This is why one visitor can get a 429 while everyone else browses normally, and also why a shared proxy or office network can get an entire group blocked together if the scoping key ends up being shared rather than unique per person.
Finally, not every layer counts requests the same way. Common approaches include fixed windows (a hard reset per minute), sliding windows (a rolling count instead of a hard reset), token buckets (a refillable allowance that permits short bursts), and leaky buckets (a steady, fixed processing rate with no bursts at all).
Cloudflare, Nginx’s limit_req module, and plugins like Wordfence each use their own combination of these, which is the practical reason the same burst of traffic can pass cleanly through one layer and get rejected by another sitting right next to it.
How to Identify the Source Using HTTP Headers
Run this from a terminal, replacing the URL with your own:
curl -I https://yoursite.com
Here’s what a typical 429 response looks like, and what each line tells you:
HTTP/2 429
retry-after: 60
server: cloudflare
cf-ray: 7d3f9a2b1e4c0000-LAX
content-type: text/html
HTTP/2 429confirms the status code itself.retry-after: 60tells you exactly how many seconds to wait before the block clears.server: cloudflareandcf-rayconfirm Cloudflare generated this response, not WordPress.- The absence of any WordPress-specific headers means the request never reached your site at all.
It’s also worth checking whether Googlebot gets a different response than a regular browser, since some firewalls treat known crawler user agents differently:
curl -I -A "Googlebot" https://yoursite.com
curl -I -A "Mozilla/5.0" https://yoursite.com
Comparing the two responses tells you quickly whether a crawler-specific rule is involved, without waiting on Search Console data.
These are the headers worth recognizing once you have a response in hand, whatever generated it:
| Header | Meaning |
|---|---|
Retry-After | How long to wait before retrying, in seconds or as a date |
X-RateLimit-Limit | The maximum number of requests allowed in the current window |
X-RateLimit-Remaining | How many requests are left before the limit is hit |
X-RateLimit-Reset | When the current rate-limit window resets |
cf-ray | Cloudflare’s unique identifier for the request, useful when contacting their support |
Match whatever you found against this table to identify the source in seconds:
| Header Found | What It Means |
|---|---|
cf-ray | Cloudflare generated the response |
server: nginx | Request reached your origin web server |
server: litespeed | Origin is running LiteSpeed |
x-cache | A CDN or caching layer was involved in serving the request |
x-powered-by: PHP | The request reached PHP, ruling out a pure edge-level block |
x-wf-block | Wordfence generated the response |
retry-after present, no other custom headers | Likely a genuine rate limit rather than a hard block |
A bare HTTP/2 429 with none of these headers usually means the block is happening quietly at a layer that doesn’t bother explaining itself, often a sign of a host-level rule rather than a plugin.
A few more advanced curl variations (following redirects, forcing HTTP/2, showing the full TLS handshake) are covered in the Developer Reference near the end of this guide, useful if you need to dig deeper into a proxy chain.
Using Browser DevTools
Most site owners actually find this error through their browser first. Here’s the path:
- Open DevTools (F12 or right-click → Inspect) and go to the Network tab.
- Reload the page and find the request marked in red with status 429.
- Click it and open the Headers panel.
- Check the Response Headers section for
retry-after,server, and any custom rate-limit headers. - Switch to the Timing tab to see whether the request was blocked instantly or after a delay, which hints at whether it’s an edge-level or origin-level block.
Reading Your Server and Security Logs
Headers tell you what happened on one request. Logs tell you the pattern, which matters more when the error is intermittent.
Nginx
tail -f /var/log/nginx/error.log
A rate-limited request shows up like this:
limiting requests, excess: 5.328 by zone "login", client: 203.0.113.4,
server: yoursite.com, request: "POST /wp-login.php HTTP/1.1"
That single line tells you the zone name (login), the client IP, and the exact endpoint being hit.
Apache
tail -f /var/log/apache2/error.log
Look for entries referencing mod_ratelimit or mod_evasive if either module is active on your server.
Cloudflare
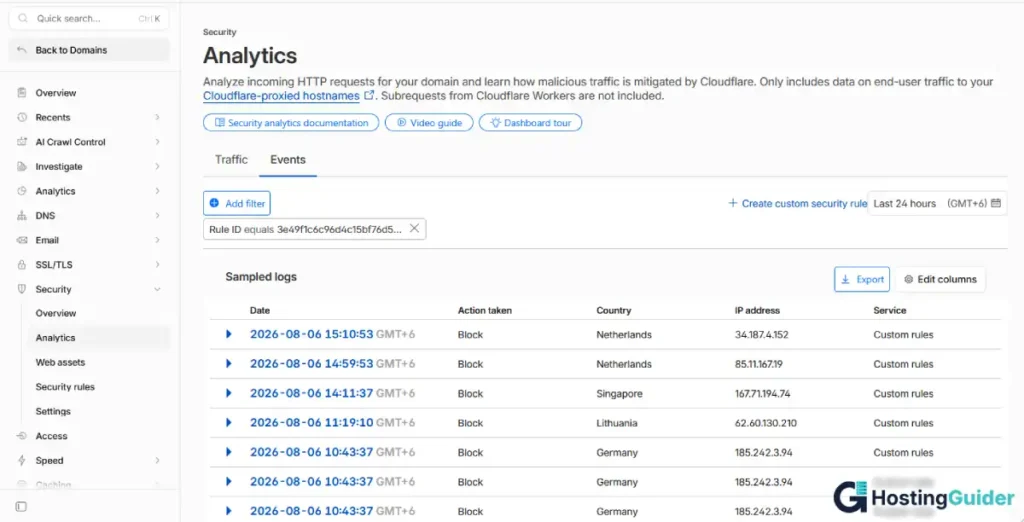
Check Security → Events in the dashboard. Each blocked or rate-limited request is logged with the rule that triggered it, the client IP, and the country of origin.
Wordfence
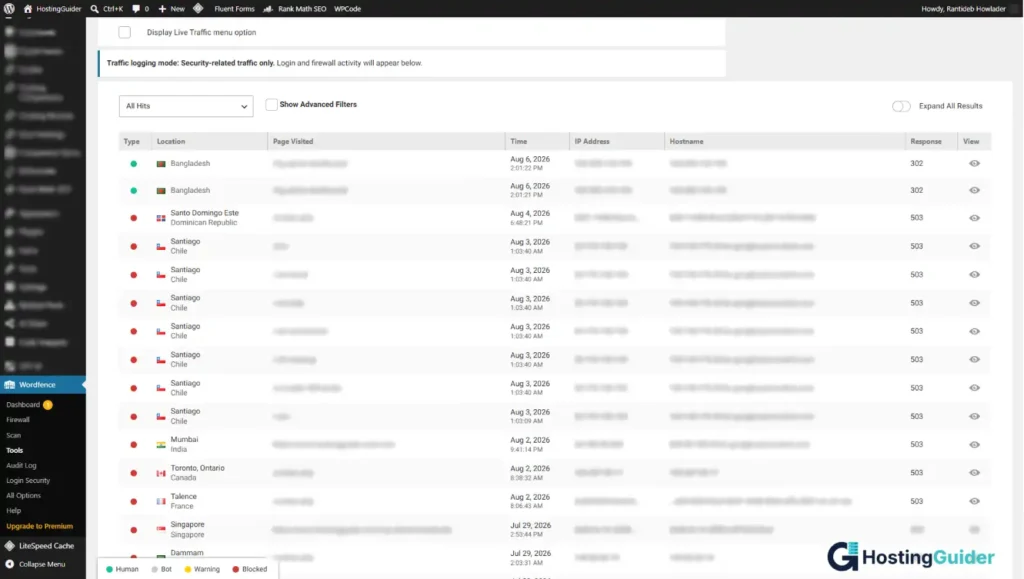
Check Wordfence → Live Traffic or Tools → Live Traffic to see blocked requests in real time, filtered by rule type.
Access Logs, Not Just Error Logs
Error logs tell you a block happened. Access logs tell you the volume and pattern behind it, which matters when the same IP is hitting one endpoint repeatedly.
tail -f /var/log/nginx/access.log | grep "429"
A brute-force pattern typically looks like the same line repeated hundreds or thousands of times:
203.0.113.5 - - [06/Aug/2026:14:22:01] "POST /wp-login.php HTTP/1.1" 429 512
203.0.113.5 - - [06/Aug/2026:14:22:02] "POST /wp-login.php HTTP/1.1" 429 512
203.0.113.5 - - [06/Aug/2026:14:22:03] "POST /wp-login.php HTTP/1.1" 429 512
One IP, one endpoint, repeated at high frequency is the signature of an automated attack rather than a real visitor running into a limit by accident.
Correlating Logs Across Layers
A single log rarely tells the whole story on an intermittent issue. Professional debugging usually means lining up several logs by timestamp to see the same request as it moves through the stack:
Cloudflare Security Event
      ↓
Nginx Access Log
      ↓
PHP-FPM Slow Log
      ↓
WordPress debug.log
      ↓
MySQL Slow Query Log
If a request shows up in the Cloudflare event log but never appears in Nginx’s access log, the block happened at the edge and never reached your server.
If it appears in Nginx but the PHP-FPM slow log shows nothing unusual at that timestamp, the delay is happening somewhere between the web server and PHP rather than inside WordPress itself.
Working through the chain in order, rather than jumping straight to the WordPress debug log, saves time on anything that doesn’t reproduce reliably.
Quick Reference: Log File Locations
| Stack | Log Path |
|---|---|
| Ubuntu, Nginx | /var/log/nginx/error.log |
| Ubuntu, Apache | /var/log/apache2/error.log |
| CentOS, Apache | /var/log/httpd/error_log |
| LiteSpeed | logs/error.log in the server root |
| OpenLiteSpeed | logs/error.log in the server root |
If you’re comfortable working from the command line, our guide on troubleshooting VPS hosting issues covers reading server logs in more depth, including how to spot patterns that don’t show up in a single request.
Diagnostic Checklist
Keep this list handy for any future 429 error, WordPress or otherwise:
- Check response headers with curl or DevTools
- Check server error logs for rate-limit entries
- Check CDN or WAF security event logs
- Check security plugin logs for custom block headers
- Deactivate all plugins and test
- Switch to a default theme and test
- Check the Heartbeat API interval
- Check whether XML-RPC is exposed and being hit
- Check wp-cron behavior
- Check PHP-FPM error logs for worker exhaustion
- Check Search Console crawl stats for Googlebot-side 429s
Fix 1: Isolate a Faulty Plugin
Difficulty: Easy · Time: 5–10 minutes · Requires: WordPress dashboard or FTP
On WordPress sites, plugins and the security layers built into them account for a large proportion of 429 incidents, so this is usually the fastest path to a fix.
Through the dashboard:
- Go to Plugins > Installed Plugins.
- Select all, choose Deactivate from bulk actions, and apply.
- Reload your site. If the error clears, a plugin was the cause.
- Reactivate plugins one at a time, checking the site after each one.
Through WP-CLI, which is faster if you manage the site over SSH:
wp plugin deactivate --all
wp plugin activate plugin-name
wp plugin status
wp cache flush
wp transient delete --all
wp plugin status gives you a quick list of what’s currently active without opening the dashboard, and wp transient delete --all clears out cached data that can sometimes mask whether a fix actually worked.
If wp-login.php itself is the page returning the 429, connect over FTP instead and rename each plugin folder inside wp-content/plugins one at a time, appending something like _off, until the site loads again.
Plugin conflicts often look identical to rate-limit errors from the outside.
Our breakdown of handling plugin conflicts on managed WordPress hosting walks through the same isolation process for other error types, which is useful if deactivating plugins doesn’t resolve your 429.
Expected result: the 429 stops as soon as the offending plugin is deactivated, and doesn’t return until you reactivate it specifically.
Fix 2: Rule Out a Theme Conflict
Difficulty: Easy · Time: 3–5 minutes · Requires: WordPress dashboard or FTP
Some themes bundle functionality that normally lives in a plugin, and that functionality can generate excessive requests on its own.
Switch to a default WordPress theme through Appearance > Themes. If wp-admin is unreachable, rename your active theme’s folder via FTP so WordPress falls back to a default automatically.
If the error clears up, report it to the theme developer or look for a lighter alternative.
Expected result: the 429 disappears on the default theme and returns only when your original theme is reactivated.
Fix 3: Check Security Plugin Rate Limiting
Difficulty: Easy · Time: 5–10 minutes · Requires: WordPress dashboard
Security plugins are a common and frequently overlooked source of 429 errors, especially on the REST API and login endpoints. Each one has its own settings for this.
| Plugin | Where to Check |
|---|---|
| Wordfence | Firewall → Rate Limiting |
| Solid Security (formerly iThemes) | Settings → Local Brute Force Protection |
| All In One Security (AIOS) | Brute Force → Login Lockdown |
| Limit Login Attempts Reloaded | Settings → Login Threshold |
| Sucuri Security | Firewall → WAF Settings |
If deactivating all plugins in Fix 1 resolved your error, reactivate your security plugin last and check its rate-limiting section before anything else.
Whitelist your own IP or the IPs of any tools that integrate with your site, such as uptime monitors, staging sync tools, or developers on a static IP.
For a broader look at how these tools fit together on a managed stack, our guide to managed WordPress security covers where plugin-level protection ends and host-level protection begins.
Expected result: the plugin’s own live-traffic or firewall log stops flagging your whitelisted IP, and the 429 stops on the affected endpoint without disabling the rule entirely.
Fix 4: Throttle the WordPress Heartbeat API
Difficulty: Medium · Time: 5 minutes · Requires: functions.php access or a plugin
This is one of the quieter causes, and it rarely appears in generic troubleshooting lists. The Heartbeat API runs in the background of wp-admin to power autosave, post locking, and live notifications, sending a request as often as every 15 to 60 seconds per open browser tab.
On a site with several editors logged in at once, or a tab left open overnight, that adds up fast.
Slow it down by adding this to your theme’s functions.php:
add_filter('heartbeat_settings', function($settings) {
    $settings['interval'] = 60;
    return $settings;
});
If you’d rather avoid editing code, a lightweight plugin like Heartbeat Control disables it on the frontend entirely and limits it to only the post editor screen.
Expected result: intermittent 429s in wp-admin (not on the public site) stop once the interval is raised, particularly with multiple editors logged in at once.
Fix 5: Disable XML-RPC
Difficulty: Easy · Time: 5 minutes · Requires: a plugin or .htaccess access
xmlrpc.php handles the WordPress mobile app and some remote publishing tools, but it’s also a favorite target for brute-force and pingback abuse.
A flood of requests against this single file is a quiet, common cause of 429 errors that never shows up as a normal login attempt.
If you don’t rely on the mobile app or a client that needs it, disable it entirely. Most security plugins include a toggle for this under their firewall or hardening settings.
Without a plugin, block it directly in .htaccess:
<Files xmlrpc.php>
Order Deny,Allow
Deny from all
</Files>
Our full guide on protecting a WordPress site covers XML-RPC alongside other hardening steps worth applying at the same time, since sites that get hit by pingback abuse are often exposed in more than one place.
Expected result: requests to xmlrpc.php return a 403 immediately instead of reaching WordPress, and wp-login.php 429s tied to pingback abuse stop.
Fix 6: Fix Mixed HTTP and HTTPS Content
Difficulty: Easy · Time: 10 minutes · Requires: WordPress dashboard, a search-and-replace plugin
If your site address and URLs aren’t consistently set to HTTPS, browsers can bounce between the two, and each bounce counts as another request against any rate limit in place.
Go to Settings > General and confirm both the WordPress Address and Site Address use https://.
Run a search and replace across your database (Better Search Replace works well) to update old http:// links buried in posts, widgets, or theme options. If you’re not sure your certificate itself is configured correctly, double-check that before chasing a redirect loop further.
Expected result: the redirect chain in curl -IL drops to a single hop, and the request count against any rate limit falls accordingly.
Fix 7: Debug wp-cron and REST API Activity
Difficulty: Medium · Time: 15–20 minutes · Requires: wp-config.php access, WP-CLI or Query Monitor
By default, wp-cron.php fires on every single page load rather than on a real schedule. On a busy site, that’s far more requests than necessary.
Disable the default behavior in wp-config.php:
define('DISABLE_WP_CRON', true);
Then set up a real server-side cron job through your hosting control panel to call wp-cron.php on a fixed interval, such as every 15 minutes.
Check cron activity directly with WP-CLI:
wp cron event list
wp cron event run --all
wp option get home
wp cron event run --all lets you fire every scheduled event immediately and watch what happens, which is useful for catching a task that’s silently triggering a burst of requests each time it runs.
To catch a plugin or integration hammering the REST API or admin-ajax.php, install Query Monitor.
It shows every AJAX and REST request fired on a page load, along with which plugin triggered it. Debug Bar works similarly if you prefer a lighter tool.
It helps to recognize what you’re looking at once Query Monitor shows you the endpoint. A few you’ll commonly see:
/wp-json/wp/v2/posts: the core REST API fetching post data, often used by block editor features or headless setups/wp-json/wc/store/cart: WooCommerce’s storefront cart endpoint, called repeatedly during shopping sessions/wp-json/contact-form-7/v1/contact-forms/: Contact Form 7 validating and submitting forms via AJAX
Seeing a high volume of calls to any single endpoint like these is a strong signal of where to focus, rather than guessing at the plugin responsible.
You can also enable debug logging directly in wp-config.php:
define('WP_DEBUG', true);
define('WP_DEBUG_LOG', true);
define('WP_DEBUG_DISPLAY', false);
Then watch wp-content/debug.log for a pattern of repeated calls to the same endpoint.
Expected result: wp-cron stops firing on every page load, and Query Monitor shows a clear drop in repeated calls to whichever endpoint was misbehaving.
A Few More Causes Worth Checking
Three causes that don’t fit neatly into a single fix above, but show up often enough to name directly:
Broken redirect loops. An HTTP to HTTPS loop, a www to non-www mismatch, or a plugin-level redirect rule that contradicts your server config can chain dozens of redirects in seconds, functionally identical to a request flood even though a single visitor triggered it. If curl -IL shows the same URL appearing repeatedly before the 429, a redirect loop is the actual cause, not traffic volume.
Plugins that poll constantly. Beyond the Heartbeat API covered in Fix 4, several popular plugins generate their own frequent REST or AJAX traffic as part of normal operation. Elementor’s editor, Fluent Forms, WP Activity Log, Rank Math’s analytics module, Jetpack’s sync process, and Broken Link Checker are common examples.
None of these are bugs exactly, but their combined polling can add up on a site running several of them together. Query Monitor, covered in Fix 7, will show you which one, if any, is contributing meaningfully.
Browser extensions. Rarely, but occasionally: password managers, SEO toolbars, security extensions, or auto-refresh extensions running in a visitor’s browser can fire extra requests against your site without the visitor realizing it.
This mostly matters if you’re trying to reproduce a 429 reported by one specific person and can’t, since disabling extensions is a reasonable next troubleshooting step before assuming server-side.
Fix 8: Rule Out PHP-FPM Exhaustion
Difficulty: Advanced · Time: 20–30 minutes · Requires: SSH/root access to the server
This is a commonly confused issue that can mimic 429 symptoms without actually being a rate limit. When PHP-FPM runs out of available workers, it typically returns a 502 or 503, not a 429.
But the site-wide slowdown and intermittent failures feel similar enough that people troubleshoot it as a rate-limit issue and waste time.
Our breakdown of what happens when a server crashes walks through the broader diagnosis process if PHP-FPM exhaustion turns out to be part of a bigger resource problem rather than an isolated config issue.
Check your PHP-FPM configuration (usually in www.conf or a pool-specific file):
pm.max_children = 20
pm.max_requests = 500
request_terminate_timeout = 120
If pm.max_children is set too low for your traffic, requests queue up and start timing out under load. Raising it (within what your server’s RAM can support) resolves the slowdown.
Two more directives worth knowing during diagnosis:
pm.status_path = /status
slowlog = /var/log/php-fpm-slow.log
request_slowlog_timeout = 5s
pm.status_path exposes a live status page showing active and idle workers, which tells you at a glance whether you’re actually hitting the worker limit.
The slowlog and request_slowlog_timeout directives log any request that takes longer than the threshold, which helps pinpoint a specific slow plugin or query rather than guessing from a general slowdown.
If the slowlog keeps pointing at database calls specifically, that’s a sign the fix is query optimization rather than more server resources.
Visiting the status path (through a tool like curl locally, since it shouldn’t be exposed publicly) returns output like this:
pool:                 www
process manager:      dynamic
start time:            06/Aug/2026:09:00:00 +0000
accepted conn:         48213
listen queue:          0
max listen queue:      3
listen queue len:      128
idle processes:        2
active processes:      18
total processes:       20
max active processes:  20
max children reached:  4
active processes sitting at or near total processes, combined with a nonzero max children reached count, confirms you’re genuinely running out of workers rather than dealing with something else entirely.
A nonzero listen queue means requests are already waiting for a free worker, which is an earlier warning sign worth acting on before it turns into full exhaustion.
This is a separate fix from anything rate-limit related, but ruling it out early saves time when a site is behaving strangely under load.
Expected result: max children reached stops climbing under load, and the site-wide slowdown (502s/503s, not literal 429s) resolves.
Fix 9: Configure Server-Level Rate Limiting Correctly
Difficulty: Advanced · Time: 20–30 minutes · Requires: SSH/root access, or your host’s support team
If your log check in the diagnosis section pointed to Nginx or Apache directly, the fix lives in your web server config rather than in WordPress.
Nginx, using the limit_req module, commonly applied to login pages and XML-RPC:
limit_req_zone $binary_remote_addr zone=login:10m rate=5r/s;

location /wp-login.php {
    limit_req zone=login burst=10 nodelay;
}
If legitimate traffic is getting caught, raise the rate value or increase the burst allowance.
Apache, using mod_evasive to detect and temporarily block abusive request patterns, is configured through its own module settings rather than .htaccess, and usually needs a server admin or your host to adjust.
LiteSpeed and OpenLiteSpeed expose rate limiting under the server-level or virtual host Throttle Configuration panel, separate from any WordPress plugin settings. If your host runs LiteSpeed, check there before assuming a plugin is responsible.
Restart the service after changes with lswsctrl restart, or through the WebAdmin console if you don’t have shell access.
On self-managed servers, these changes require root or sudo access. On managed hosting, ask support to adjust the specific rule rather than trying to override it yourself.
Always Test Before Reloading
A config typo in a rate-limiting rule can take your entire site down, not just fix the 429. Test the syntax before applying changes:
nginx -t
systemctl reload nginx
apachectl configtest
systemctl reload apache2
Reload rather than restart where possible, since a reload applies the new config without dropping active connections.
ModSecurity and OWASP CRS
If ModSecurity sits in front of your web server, it can generate 429s (or 403s, depending on configuration) independently of anything else in this guide, based on its own rule set. Many managed hosts run the OWASP Core Rule Set (CRS), which ships with generic rules that occasionally flag legitimate WordPress traffic as suspicious, particularly on the REST API or admin-ajax.php.
Check whether SecRuleEngine is set to On (actively blocking) or DetectionOnly (logging without blocking) in the ModSecurity config, and review audit.log for the specific rule ID that fired.
Once you have a rule ID, you can add a targeted exception for that rule on the specific endpoint rather than disabling ModSecurity site-wide.
Our broader look at how web hosting firewalls work covers where ModSecurity and WAF layers typically sit relative to each other if you’re not sure what’s actually running on your stack.
Fail2Ban, CrowdSec, and Firewall-Level Blocking
On a self-managed VPS, tools like Fail2Ban, CrowdSec, CSF, or a plain iptables or ufw rule can produce something that looks identical to a 429 from the outside, even though they’re operating below the web server entirely.
These tools watch logs for patterns (repeated failed logins, for example) and block the offending IP at the network level.
The practical difference: a true HTTP 429 comes with a response, however minimal. A firewall-level block at this layer often results in the connection simply timing out, with no HTTP response at all. If curl -I hangs or times out rather than returning a status code, the block is likely happening at this layer rather than inside WordPress or your web server, and the fix means checking fail2ban-client status or your firewall’s ban list rather than anything covered in the fixes above.
Expected result: nginx -t or apachectl configtest passes cleanly, and legitimate traffic previously caught by the rule (checked via access log) no longer trips it while the config still blocks obvious abuse.
Fix 10: Review CDN and Firewall Rate Limit Rules
Difficulty: Medium · Time: 10–15 minutes · Requires: access to your CDN/WAF dashboard
If your header check pointed to a CDN, the 429 is generated before WordPress ever sees the request. That’s good for security, but the thresholds sometimes need adjusting for how your site actually behaves.
| CDN / WAF | Where to Check |
|---|---|
| Cloudflare | Security → Events, then Security → WAF → Rate Limiting Rules |
| Sucuri | Firewall dashboard → Access Logs |
| Bunny CDN | Shield → Traffic logs |
| Fastly | Edge logs via the Fastly dashboard |
| AWS CloudFront | WAF & Shield console |
| Imperva | Security Events dashboard |
| Imunify360 / BitNinja | Server-level security dashboard, common on shared and reseller hosting rather than configured by the site owner directly |
| Akamai | Akamai Control Center, typically enterprise-tier and managed by a dedicated ops team |
Check whether legitimate patterns, like a WooCommerce checkout flow or your own REST API integrations, are getting caught in rules meant for bots.
Whitelisting your server’s IP or known integration sources, and loosening limits on specific endpoints like /wp-json/ or /wp-admin/admin-ajax.php, usually resolves it without weakening overall protection.
Misconfigured CDN rules cause more than just 429 errors. Our piece on CDN misconfiguration and site slowdowns covers related symptoms worth checking while you’re already in the dashboard.
Cloudflare Error Codes That Get Confused With 429
Cloudflare in particular returns several error codes that look similar to a rate limit but mean something different:
| Code | Meaning |
|---|---|
| 429 | Too many requests, rate limit rule triggered |
| 403 | Forbidden, usually a firewall or access rule, not a rate limit |
| 520 | Origin returned an unexpected or empty response |
| 522 | Connection to the origin timed out |
| 524 | Origin took too long to send a complete response |
If you’re seeing 520, 522, or 524 alongside occasional 429s, the underlying issue may be origin server performance rather than rate limiting at all, and the fixes in this guide won’t resolve it. That points back toward the PHP-FPM and server performance checks covered earlier.
A Note on HTTP/3
Some CDNs apply rate-limiting logic slightly differently under HTTP/3 and QUIC compared to HTTP/2, since connection handling itself works differently at the protocol level.
If your site serves traffic over HTTP/3 and you’re seeing inconsistent 429 behavior between browsers or tools, it’s worth testing with curl --http1.1 and curl --http2 explicitly to rule out a protocol-specific quirk before assuming the rate-limit rule itself is misconfigured.
Expected result: the cf-ray header stops appearing on legitimate requests to the affected endpoint, while Security Events still shows the rule catching genuine abuse.
WooCommerce and 429 Errors
WooCommerce stores deserve their own section, since they generate legitimate request bursts that generic rate limits often weren’t designed for.
admin-ajax.php handles most of the store’s real-time behavior:
- Cart fragment updates on every add-to-cart action
- Checkout field validation as a customer types
- Payment gateway calls during checkout
- Live inventory and stock validation
- Product filtering on shop and category pages
A single customer session can fire dozens of these calls in a few minutes, especially on a slow connection where retries stack up. If your rate limit was tuned for a brochure site, a busy store will trip it constantly during checkout.
The specific endpoints worth whitelisting or raising limits for, by name:
/wp-admin/admin-ajax.php?action=wc-ajax=get_refreshed_fragments: cart fragment refresh, fired constantly during browsing/wp-json/wc/store/cart: the Store API’s cart endpoint, used heavily by block-based checkout/wp-json/wc/store/products: product data for the block-based shop and cart/wp-admin/admin-ajax.php?action=woocommerce_checkout: the classic checkout form submission- Payment gateway callback URLs (varies by processor, but these hit your site directly from Stripe, PayPal, and similar)
The fix is usually to raise the request threshold specifically for /wp-admin/admin-ajax.php and /wp-json/wc/ at the CDN, firewall, or Nginx level, rather than loosening the site-wide limit.
Logged-in users can also often be exempted from stricter anonymous-traffic rules, since checkout activity always happens from an authenticated or session-tracked visitor. This is exactly the pattern behind the client case study later in this guide, where a Cloudflare rule scoped too broadly caught legitimate checkout traffic during a sale.
Outbound API Rate Limits
Not every 429 originates on your server. Plugins that connect to external services carry their own rate limits, and when those are exceeded, the 429 can surface inside your WordPress admin or on the frontend.
Common examples:
- Payment plugins calling Stripe or PayPal
- AI-powered content or chat plugins calling OpenAI
- Email marketing plugins syncing with Mailchimp
- Social feed plugins pulling from Facebook or Instagram
- SEO plugins checking rankings against Google APIs
If a plugin shows a 429 in an admin notice or error log, check whether the message references an external service name. Some plugins retry automatically, some fail silently, and some pass the raw error straight through to you.
The fix here isn’t server-side at all. It usually means reducing how often the plugin polls, or checking your API key’s tier and limits with that specific provider.
Telling this apart from a 429 your own site generated comes down to where the evidence points. A 429 that shows up as plain text in wp-admin, references a provider by name, or appears in a plugin’s own error log almost always originated at that external API, not on your server.
A 429 your curl or DevTools check caught with a cf-ray, Nginx, or Wordfence header attached, by contrast, was generated by your own infrastructure. Checking the request destination in Query Monitor, an outbound call to api.stripe.com versus an inbound request to your own /wp-json/, settles it when the source still isn’t obvious.
Third-Party Clients Triggering 429
A surprising share of WordPress 429 errors have nothing to do with a human visitor at all. Automation tools that connect to your site over the REST API can generate rapid, repeated requests that look identical to bot abuse from the server’s point of view:
- Zapier, Make, or n8n polling for new posts, form entries, or WooCommerce orders
- Slack or Discord integrations posting updates on a schedule
- GitHub webhooks firing on every push to a connected repository
- A mobile app or headless frontend making frequent REST API calls
- External cron or monitoring services hitting a specific endpoint on an interval
If you use any of these, check their polling interval before assuming the block is malicious.
Most automation platforms let you slow the polling frequency, and most WordPress security plugins let you whitelist a specific API key, IP range, or user agent rather than opening the endpoint to everyone.
Identifying Bots in Your Logs
Not every automated request is hostile, and the fix depends heavily on which kind you’re looking at. Checking the User-Agent string in your access logs is the fastest way to tell them apart.
Common legitimate bots:
Googlebot,Bingbot: search engine crawlersAhrefsBot,SemrushBot: SEO tools, often used by you or a competitor auditing your siteUptimeRobot,Pingdom: uptime monitoring services
Common signs of scraping or abuse:
MJ12Bot: a crawler frequently associated with aggressive, unthrottled scrapingcurl,python-requests,Go-http-client: generic client libraries, which legitimate integrations sometimes use but which also show up constantly in scripted attacks- A blank or missing
User-Agententirely, which most real browsers never send
A generic client library in your logs isn’t automatically malicious. It’s worth checking the request pattern (volume, target endpoint, and whether it respects Retry-After) rather than blocking on user agent alone, since plenty of legitimate integrations also identify themselves this way.
A Note on Load Testing
If you’re deliberately stress-testing a site with a tool like k6, ApacheBench, or Siege, a 429 during the test may not be a bug at all.
Generating thousands of requests in a short window is exactly the pattern rate limiting exists to catch, and the block you’re seeing could simply be your own protection working as intended.
Before troubleshooting a 429 that showed up during or right after a load test, check whether the traffic source was your own testing tool.
Whitelisting your testing IP, or running the test from a staging environment with rate limiting temporarily relaxed, avoids chasing a problem that isn’t really one.
Host-Specific Notes
Where you find logs and rate-limit settings depends heavily on your hosting environment.
| Host / Stack | Where to Look |
|---|---|
| Kinsta | MyKinsta → Site → Logs, plus their built-in edge caching rules |
| WP Engine | User Portal → Logs, and their proprietary WAF settings |
| SiteGround | Site Tools → Statistics → Web Server Logs |
| Hostinger | hPanel → Advanced → Access/Error Logs |
| Cloudways | Server → Manage → Logs, or via SSH on the application |
| DigitalOcean (self-managed) | /var/log/nginx/error.log or /var/log/apache2/error.log directly |
| RunCloud | Server → Logs section in the RunCloud dashboard |
| Plesk | Domains → Logs |
| cPanel | Metrics → Errors, or Raw Access Logs |
Managed hosts often apply their own rate limiting at the platform level, separate from anything WordPress or a plugin controls, which is why the same fix that works on a self-managed VPS sometimes has no effect on Kinsta or WP Engine. If you’ve ruled out plugins, theme, and CDN, and you’re on managed hosting, this platform layer is the next place to ask about.
Our overview of what managed WordPress hosting actually manages explains which of these protections are handled for you versus what you’re still responsible for configuring yourself.
What the Error Actually Looks Like, by Host
The generic 429 Too Many Requests message is usually wrapped in host-specific branding, which is worth recognizing if you’re trying to confirm the source at a glance:
- Hostinger typically shows a plain Error 429: Too Many Requests, please try again later page. On Hostinger this is most often ModSecurity or their Imunify360-based protection rather than anything WordPress-level, and LiteSpeed’s own throttle settings are worth a look too since that’s their default web server.
- Kinsta wraps the error in their own branded error page rather than a bare status line, generated by their edge caching and firewall layer before the request reaches your site.
- WP Engine similarly shows a branded error page, generated by their proprietary WAF rather than Nginx or Apache directly, so their support team’s WAF logs are the fastest path to an answer.
- SiteGround generally passes through a plainer server-level message, consistent with their Site Tools-based logging shown in the table above.
If your error page has obvious host branding rather than a bare browser default, that’s itself a signal the block happened at the platform layer before WordPress or a plugin had any involvement.
Containers and Load Balancers
WordPress running on Docker, Kubernetes, or a platform like Coolify, CapRover, Dokploy, Fly.io, or Railway adds its own layer to the request path, and rate limiting can be applied at the ingress controller or platform level rather than anywhere covered above.
If you’re on one of these stacks, check the platform’s ingress or reverse proxy configuration (Nginx Ingress, Traefik, or the platform’s built-in proxy) before assuming WordPress or a plugin is responsible.
Load balancers deserve a separate mention too. AWS ALB, DigitalOcean’s load balancer, and HAProxy or Nginx acting as a load balancer all send periodic health checks to confirm your backend is alive. On a small or resource-constrained instance, a health check hitting on a short interval can itself be significant traffic.
In rare cases this can contribute to worker exhaustion or trip a rate limit meant for real visitors. Checking your load balancer’s health check interval and target endpoint is worth a quick look if the pattern doesn’t match anything else in this guide.
Shared Hosting Resource Limits
Shared hosting plans commonly cap CPU usage, entry processes, concurrent connections, and I/O separately from any explicit rate limit.
These caps don’t always produce a 429 directly, but some hosts translate an exhausted resource limit into a rate-limited response rather than a plain 503, which can make a resource problem look identical to the rate-limiting issues covered throughout this guide.
If none of the fixes above change anything and you’re on shared or entry-level hosting, ask support directly whether you’re hitting a resource cap rather than a configured rate limit.
Is Googlebot Getting Blocked Too?
If visitors aren’t complaining but organic traffic has quietly dropped, check whether search engine crawlers are hitting the same rate limit.
Open Google Search Console and go to Settings → Crawl Stats. A spike in 429 or general server error responses under the crawl requests breakdown means Googlebot is being throttled, usually by the same plugin, firewall rule, or hosting limit affecting everyone else.
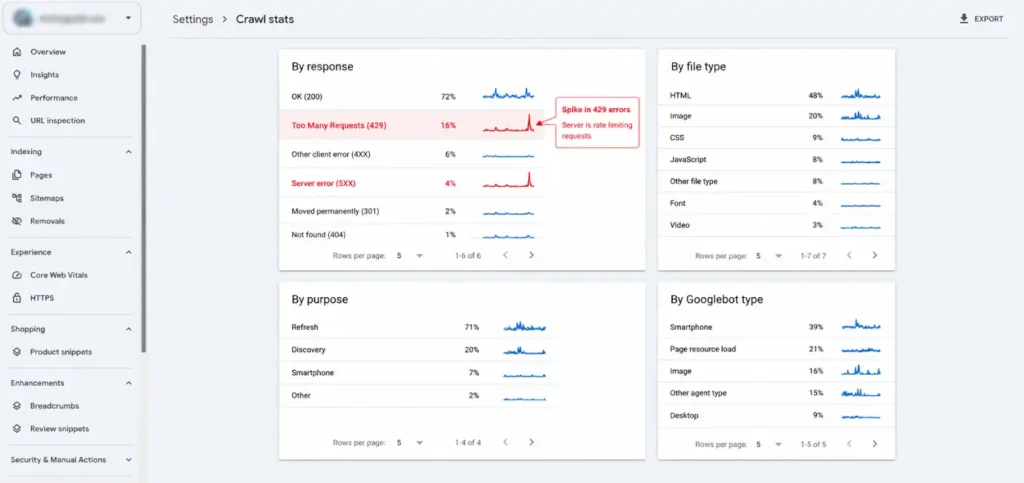
This matters because a crawler that keeps getting rate limited visits your site less often, which slows down how quickly new content gets indexed.
Since hosting choices already influence search rankings in more ways than most site owners expect, a 429 hitting Googlebot specifically is worth prioritizing over a fix that only addresses the visitor-facing symptom.
Whitelist known Googlebot IP ranges or verify its user agent in your firewall settings rather than only fixing things from the human-visitor side.
Troubleshooting Decision Tree
Use this as a quick mental flow when a fresh 429 shows up:
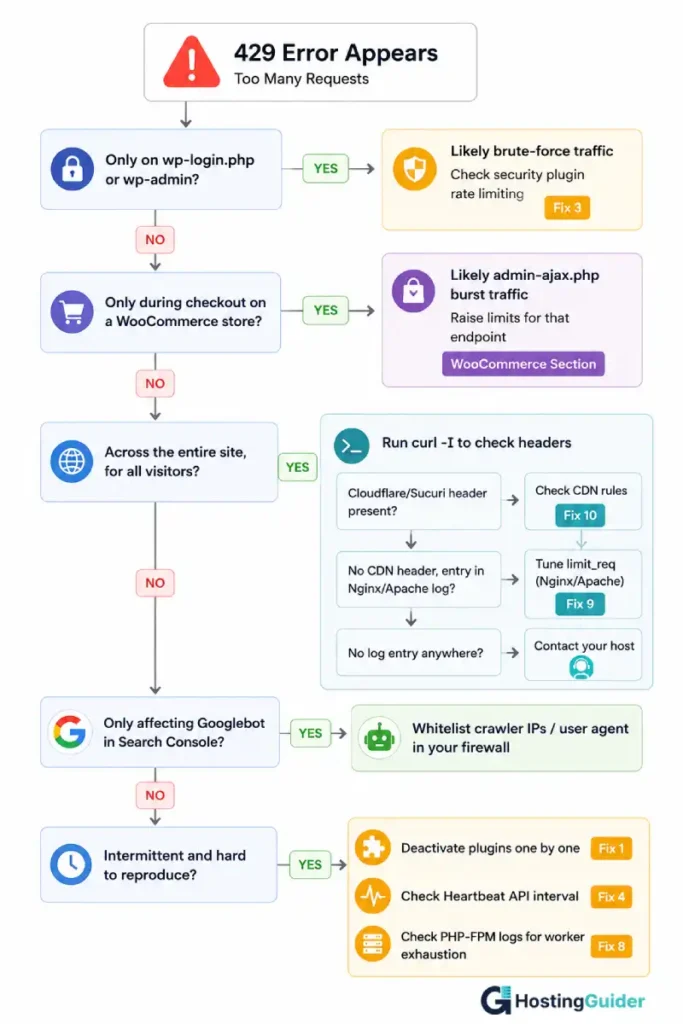
429 error appears
 │
 ├─ Only on wp-login.php or wp-admin?
 │     → Likely brute-force traffic
 │     → Check security plugin rate limiting (Fix 3)
 │
 ├─ Only during checkout on a WooCommerce store?
 │     → Likely admin-ajax.php burst traffic
 │     → Raise limits for that endpoint (WooCommerce section)
 │
 ├─ Across the entire site, for all visitors?
 │     → Run curl -I to check headers
 │     → Cloudflare/Sucuri header present? → Check CDN rules (Fix 10)
 │     → No CDN header, entry in Nginx/Apache log? → Tune limit_req (Fix 9)
 │     → No log entry anywhere? → Contact your host
 │
 ├─ Only affecting Googlebot in Search Console?
 │     → Whitelist crawler IPs/user agent in firewall
 │
 └─ Intermittent and hard to reproduce?
       → Deactivate plugins one by one (Fix 1)
       → Check Heartbeat API interval (Fix 4)
       → Check PHP-FPM logs for worker exhaustion (Fix 8)
Escalation Criteria
If you still can’t identify the source after checking response headers, origin logs, CDN events, and plugin activity, the rate limit is probably being enforced by your hosting provider or an upstream proxy you don’t have visibility into. At that point, further guessing rarely helps.
Before contacting support, collect:
- The exact timestamp of a recent occurrence
- The client IP involved, if known
- The
cf-rayvalue from the response headers, if present - The relevant log entries you’ve already gathered
Handing over specifics like these gets a faster answer than describing the symptom alone, since it lets support jump straight to checking the layer they control instead of retracing steps you’ve already ruled out.
How to Verify the Problem Is Actually Solved
Applying a fix isn’t the same as confirming it worked. Before considering a 429 closed, check all four of these:
- Run
curl -Iagain against the endpoint that was failing and confirm you get a cleanHTTP 200instead of429. - Watch the relevant log (Nginx error log, Wordfence live traffic, or Cloudflare Security Events, whichever matched your original diagnosis) for a few minutes to confirm no new entries appear under normal use.
- Let an uptime monitor run for 24 hours and confirm no alerts fire, since some causes (Heartbeat, wp-cron, a specific traffic pattern) only reappear under conditions that a single manual test won’t reproduce.
- Check Search Console’s crawl stats a few days later if Googlebot was affected, since crawl recovery lags behind the actual fix by a day or more.
A fix that passes the immediate curl check but hasn’t been watched for a day is only half confirmed, particularly for anything tied to a schedule (Heartbeat, cron) or to a traffic pattern (checkout, a crawl) rather than a constant condition.
Real-World Scenarios
A client’s WooCommerce checkout started failing during a seasonal sale. This is one I worked through directly. A client reached out after checkout began failing for a portion of customers right as a seasonal sale went live.
The homepage loaded fine, and browsing worked normally. Customers only ran into trouble at checkout, where some got an intermittent 429 instead of an order confirmation.
I started where this guide starts: curl -I against the checkout endpoint. The response came back with a cf-ray header, which meant the request was being rejected by Cloudflare before it ever reached the origin server.
That ruled out a plugin or PHP-FPM issue immediately and pointed straight at the CDN layer.
Cloudflare’s Security Events log confirmed it. A rate-limiting rule, originally set up to catch brute-force login attempts, was scoped broadly enough that it was also catching the burst of admin-ajax.php calls WooCommerce fires during checkout: cart validation, payment gateway calls, and stock checks all firing in quick succession from the same session.
Under normal browsing that volume never showed up. Under sale-day traffic, with more concurrent shoppers hitting checkout at once, it tripped the rule constantly.
The fix wasn’t to loosen the rule broadly, which would have undone the protection it existed for.
I raised the request threshold specifically for /wp-admin/admin-ajax.php, left the rest of the WAF configuration untouched, and confirmed with the client’s team that login and comment-spam protection were still working as expected.
Checkout errors stopped within minutes of the change going live, and the site kept the same protection against actual bot traffic it had before.
The takeaway that’s shaped how I approach every 429 since: a site-wide symptom doesn’t always need a site-wide fix.
Scoping the change to the exact endpoint causing trouble, rather than raising a limit globally, fixes the real problem without opening the door to the abuse the rule was originally there to stop.
A security plugin blocked Googlebot. A site owner noticed a slow decline in indexed pages over several weeks. Search Console crawl stats showed a steady run of 429 responses.
The cause was a security plugin’s aggressive rate-limiting rule that didn’t distinguish Googlebot’s crawl rate from bot abuse. Whitelisting Googlebot’s user agent resolved it within days.
The Heartbeat API flooded admin-ajax.php. A membership site with several editors working simultaneously kept seeing intermittent 429s in wp-admin, but never on the public site. Query Monitor revealed the Heartbeat API firing every 15 seconds from four open tabs at once.
Slowing the interval to 60 seconds cleared it.
An XML-RPC attack triggered login failures. A blog with no mobile app usage was seeing 429s specifically on wp-login.php, even though no one was actually trying to log in. Log review showed thousands of POST requests to xmlrpc.php, a classic pingback abuse pattern.
Disabling XML-RPC entirely stopped it.
A plugin update introduced a stricter default rate limit. After a routine security plugin update, /wp-json/ requests started returning 429 responses that hadn’t appeared before. Rolling the plugin back briefly confirmed the update itself was the cause, not a change in traffic.
The new version shipped with a tighter default REST API rate limit than the previous one. Adjusting that specific threshold in the plugin’s settings restored normal behavior without needing to roll back permanently or disable protection.
Caching and Performance to Prevent Future 429s
Reducing how often WordPress has to process a request in the first place is one of the most effective long-term defenses against rate-limit errors.
- Page caching (WP Rocket, W3 Total Cache) serves static HTML for repeat visitors instead of rebuilding the page each time.
- Object caching (Redis or Memcached) reduces repeated database queries that plugins might otherwise trigger on every load.
- Opcode caching (OPcache) speeds up PHP execution itself, reducing how long each request holds a PHP-FPM worker.
- CDN edge caching serves static assets without hitting your origin server at all.
Our deeper breakdown of how caching affects website speed covers how each layer fits together, which is useful context once you’ve fixed the immediate 429 and want to prevent the next one.
Prevention Checklist
- Keep plugins and themes updated, since rate-limiting bugs get patched quickly once reported
- Enable page and object caching to reduce raw request volume
- Review security plugin rate-limit settings after major traffic changes, like a launch or a viral post
- Check Search Console crawl stats periodically, not only when traffic drops
- Watch newly installed plugins closely for the first few days
- Keep an eye on PHP-FPM worker usage during traffic spikes
- Document your CDN and firewall rules so future changes don’t accidentally reintroduce the issue
Mistakes to Avoid
A few reflexive fixes tend to cause more problems than they solve:
- Don’t disable rate limiting entirely just to make the error go away. It’s there to protect the site from real abuse.
- Don’t whitelist every IP that trips a rule. That defeats the purpose of the protection you’re trying to keep.
- Don’t raise limits globally for wp-login.php when the real issue is a single misbehaving plugin or IP range.
- Don’t disable your firewall before checking its logs. You’ll lose the evidence that would have told you what was actually happening.
- Don’t increase PHP-FPM workers before confirming, through
pm.status_pathor the slowlog, that worker exhaustion is actually the problem.
When Not to Fix It
Sometimes a 429 is exactly the outcome you want, and the right response is to investigate rather than remove it.
This applies when the traffic behind it is:
- A credential-stuffing or brute-force login attack
- Deliberate REST API abuse or scraping
- A scraper or bot ignoring
robots.txtentirely
In these cases, loosening the rule that’s blocking the traffic doesn’t fix anything. It just lets the abuse through.
The better move is to confirm what the traffic actually is (using the log and bot-identification steps earlier in this guide) and, if it’s genuinely malicious, leave the block in place or tighten it further rather than treating the 429 itself as the problem.
Keep an Eye on It Going Forward
Fixing the immediate error is only half the job. A lightweight monitoring setup catches a recurrence before visitors notice:
- UptimeRobot or Better Stack for simple uptime and status-code monitoring, alerting you the moment a 429 (or any error) starts appearing.
- Netdata for real-time server metrics if you want visibility into PHP-FPM and system load without a full stack to configure.
- Grafana paired with Prometheus for a more detailed, self-hosted view if you’re already running your own metrics stack on a VPS or dedicated server.
- GoAccess for a fast, terminal-based view of access log activity when you just need a quick read on traffic patterns.
- Elastic (ELK) or Grafana Loki for centralized log aggregation across multiple servers or a more complex proxy chain, where correlating logs by hand becomes impractical.
- Sentry for catching the PHP errors and exceptions that sometimes accompany a rate-limit incident, rather than just the HTTP status code itself.
- Datadog or New Relic if you want application performance monitoring alongside infrastructure metrics, useful once a site’s traffic and stack complexity outgrow the free tools above.
Even a basic uptime check configured to alert on non-200 responses is enough to catch most recurrences early.
Developer Reference
This section is for anyone building a custom endpoint, debugging a proxy chain in more depth, or writing a plugin that needs its own rate limiting. Site owners troubleshooting a one-off error can safely skip it.
More curl Variations
curl -v https://yoursite.com
Shows the full request and response cycle, including the TLS handshake, useful when you suspect a proxy layer is intercepting the request before it reaches your origin.
curl -IL https://yoursite.com
Follows redirects while showing headers at each hop, useful for catching a 429 that only appears after an HTTP to HTTPS redirect.
curl --http2 -I https://yoursite.com
Forces an HTTP/2 request, which matters if your CDN or server behaves differently across HTTP versions.
Reproducing a Rate Limit on Purpose
To confirm a fix actually holds under load, rather than just under a single manual request, generate controlled traffic against a staging environment:
ab -n 100 -c 20 https://staging.yoursite.com/
Apache Bench, sending 100 requests with 20 concurrent connections, useful for a quick smoke test.
k6 run loadtest.js
For anything more realistic than a flat burst, k6 lets you script ramping traffic patterns closer to real checkout or login behavior.
Never run these against a production site without coordinating first.
This is also exactly the traffic pattern covered in the Load Testing note earlier in this guide, since a 429 during a deliberate test is often the rate limit working correctly rather than something to fix.
Returning a Proper 429 From Your Own Plugin
If you’re building a custom REST API endpoint or a plugin that needs its own rate limiting, WordPress makes it straightforward to respond correctly:
status_header(429);
header('Retry-After: 60');
wp_die('Too many requests. Please try again shortly.', 'Rate Limited', array('response' => 429));
Setting the Retry-After header matters as much as the status code itself. Well-behaved clients, including browsers, bots, and other API consumers, read that header and pace their retries accordingly, which prevents your own rate limiting from causing the exact retry storms it was meant to prevent.
Related WordPress Errors
A 429 is one of several errors that share overlapping causes and diagnostic steps. If you’re troubleshooting a WordPress site broadly, these are worth knowing alongside it:
- 500 Internal Server Error: usually a PHP fatal error or a plugin/theme conflict, diagnosed through
debug.lograther than request headers - 502 Bad Gateway: the web server couldn’t get a valid response from PHP-FPM or an upstream proxy, often tied to the worker exhaustion covered in Fix 8
- 503 Service Unavailable: genuine server overload or active maintenance mode, distinct from the deliberate rate limiting behind a 429
- 504 Gateway Timeout: the upstream server took too long to respond, common on slow database queries or an overloaded VPS
- 403 Forbidden: a permissions issue or a firewall/WAF rule blocking access outright, rather than a rate limit
- White Screen of Death: a PHP fatal error with
WP_DEBUG_DISPLAYturned off, hiding the actual error message from view
Related Guides
- CDN misconfiguration and site slowdowns
- Troubleshooting VPS hosting issues
- Protecting a WordPress site
- What managed WordPress hosting actually manages
Further Reading and References
A few authoritative sources worth bookmarking if you want to go deeper on the mechanics behind any of this:
- RFC 9110: HTTP Semantics, which formally defines the 429 status code and how servers are expected to use it
- Nginx
limit_reqmodule documentation for the directives referenced in Fix 9 - Cloudflare Rate Limiting documentation for configuring rules at the CDN layer
- WordPress Heartbeat API developer reference for the filter used in Fix 4
- Google Search Console crawl stats help center for interpreting the crawl requests breakdown mentioned earlier
Frequently Asked Questions
Does clearing my browser cache fix a 429 error?
Sometimes, if outdated cached data is causing repeated unnecessary requests. It won’t help if the rate limit is set server-side or triggered by a plugin, so treat it as a quick first check rather than a full solution.
How long does a WordPress 429 error usually last?
It depends on the rate limit window that was set. Login-related blocks often clear in 15 minutes to an hour. Firewall or CDN-level limits vary more widely.
If the response includes a Retry-After header, that value tells you exactly how long to wait.
Can a 429 error hurt my SEO?
Yes, if it’s happening to Googlebot rather than just human visitors. Repeated 429 responses to a crawler reduce how often your site gets crawled and indexed. Check Search Console’s crawl stats if you suspect this.
Is a 429 error the same as being hacked?
Not usually. A 429 is a rate limit doing its job, often in response to bot traffic or a misbehaving plugin, not evidence of a breach. A sudden flood of login attempts triggering it is still worth treating as a signal to review your security settings.
Why do I only see the 429 error on my login page?
This almost always points to brute-force login attempts. Bots repeatedly try to guess credentials on wp-login.php, and either WordPress, a security plugin, or your host’s firewall starts rate limiting that page specifically. Renaming your login URL and adding a login-attempt limit plugin usually resolves it.
Can I set up my own rate limiting instead of relying on my host?
Yes. Developers can hook into rest_api_init to track requests per IP and return a 429 once a threshold is crossed, giving direct control over specific endpoints instead of relying entirely on host-level or CDN defaults. This is most useful for a custom REST API endpoint that needs its own limits.
Why does WooCommerce trigger more 429 errors than a regular WordPress site?
Because checkout, cart updates, and stock validation all route through admin-ajax.php, generating far more requests per visitor session than a typical brochure site. Rate limits tuned for low-traffic sites often need raising specifically for store endpoints.
Conclusion
A 429 error on WordPress is rarely a mystery once you know where to look. Confirm which layer is issuing the block with a header check, work through plugins and theme conflicts first since they cause most cases, and don’t overlook quieter culprits like the Heartbeat API, XML-RPC abuse, or PHP-FPM exhaustion.
If the cause turns out to be a hosting, CDN, or firewall limit, your support team can usually adjust it once you hand them the specifics you found along the way.